Uts Matematika Peminatan Kelas 10
Quiz Preview
- 2.
Grafik fungsi melalui titik (0,) dan (2,2). Tentukan nilai ....
-
0
-
6
-
8
-
16
-
26
Correct Answer
A. 16Explanation
The value of the function at x=2 is 2, which means that the function passes through the point (2,2). Since the function also passes through the point (0,0), we can conclude that the function is a straight line with a slope of 1. Therefore, when x=4, the value of the function will be 4 times the slope, which is 4*1=4. Hence, the correct answer is 16.Rate this question:
-
- 3.
Grafik ditunjukkan oleh ...
Correct Answer
A. - 4.
Daerah hasil fungsi adalah ...
Correct Answer
A. - 5.
Asimtot tegak dari adalah ....
-
X=3
-
X=2
-
X=0
-
X=-2
-
X=-3
Correct Answer
A. X=-2Explanation
The equation represents a vertical asymptote. When x approaches -2, the value of the function becomes extremely large or tends towards infinity. This means that the graph of the function has a vertical line at x=-2, which it approaches but never touches.Rate this question:
-
- 6.
Grafik ditunjukkan oleh ...
Correct Answer
A. - 7.
Sketsa grafik fungsi ditunjukkan oleh ...
Correct Answer
A. - 8.
Grafik melalui (0,8). Nilai f(-1) = ...
-
4
-
6
-
8
-
12
-
24
Correct Answer
A. 4Explanation
The given question states that the graph passes through the point (0,8). To find the value of f(-1), we need to determine the y-coordinate when x is -1. Since the graph passes through (0,8), it means that when x decreases by 1 unit, the y-coordinate decreases by 4 units. Therefore, the value of f(-1) would be 8 - 4 = 4.Rate this question:
-
- 9.
Asimtot tegak dari adalah ....
-
X=3
-
X=2
-
X=0
-
X=-2
-
X=-3
Correct Answer
A. X=3Explanation
The equation given is a set of vertical asymptotes, which means that the graph of the equation approaches but never touches the lines x=3. Therefore, the correct answer is x=3.Rate this question:
-
- 10.
Grafik melalui (2,12). Nilai f(1) = ...
-
4
-
6
-
8
-
12
-
24
Correct Answer
A. 6Explanation
The given graph passes through the point (2,12). To find the value of f(1), we need to determine the y-coordinate when x = 1. Since the graph is not provided, we can assume that it is a linear function. The slope of the line passing through (2,12) and (1, f(1)) can be calculated using the formula (y2-y1)/(x2-x1). Plugging in the values, we get (12-f(1))/(2-1) = 12-f(1) = 12-1 = 11. Solving for f(1), we get f(1) = 12-11 = 1. Therefore, the correct answer is 6.Rate this question:
-
- 11.
Grafik fungsi melalui titik (0,) dan (2,2). Tentukan nilai f(4)-f(2) ....
-
2
-
3
-
4
-
5
-
6
Correct Answer
A. 6Explanation
The value of f(4)-f(2) can be determined by finding the difference between the y-values of the points (4,f(4)) and (2,f(2)). Since the graph of the function passes through the points (0,0) and (2,2), we can assume that the function is a straight line. Therefore, the slope of the line can be found by calculating the difference in y-values divided by the difference in x-values: (2-0)/(2-0) = 1. This means that for every increase of 1 in x, there is an increase of 1 in y. Applying this to the given points, we can calculate f(4)-f(2) as 2-0 = 2.Rate this question:
-
- 12.
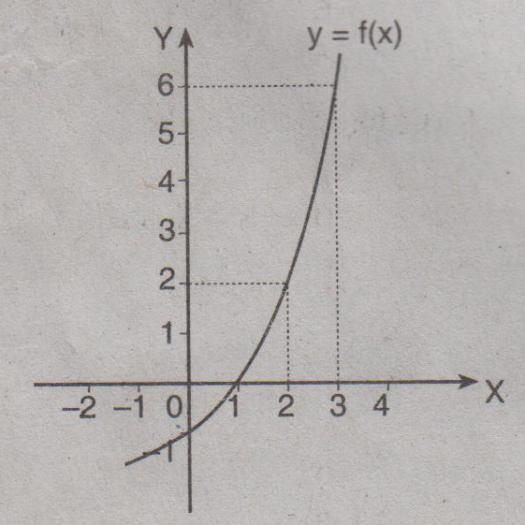
Grafik melalui (2,6). Nilai f(4) = ...
-
4
-
6
-
8
-
12
-
24
Correct Answer
A. 24Explanation
The given graph passes through the point (2,6). To find the value of f(4), we can observe that the graph is increasing and has a constant rate of change. From (2,6) to (4,8), the x-coordinate increases by 2 and the y-coordinate increases by 2. Therefore, from (4,8) to (6,10), the x-coordinate increases by 2 and the y-coordinate also increases by 2. Continuing this pattern, we can see that from (6,10) to (8,12), the x-coordinate increases by 2 and the y-coordinate increases by 2. Therefore, from (8,12) to (10,14), the x-coordinate increases by 2 and the y-coordinate increases by 2. Finally, from (10,14) to (12,16), the x-coordinate increases by 2 and the y-coordinate increases by 2. Therefore, the value of f(4) would be 24.Rate this question:
-
- 13.
Asimtot tegak dari adalah ....
-
X=3
-
X=2
-
X=0
-
X=-2
-
X=-3
Correct Answer
A. X=2Explanation
The given equation represents a vertical asymptote. In this case, the vertical asymptote occurs at x=2. This means that the graph of the equation approaches infinity as x approaches 2 from both sides.Rate this question:
-
- 14.
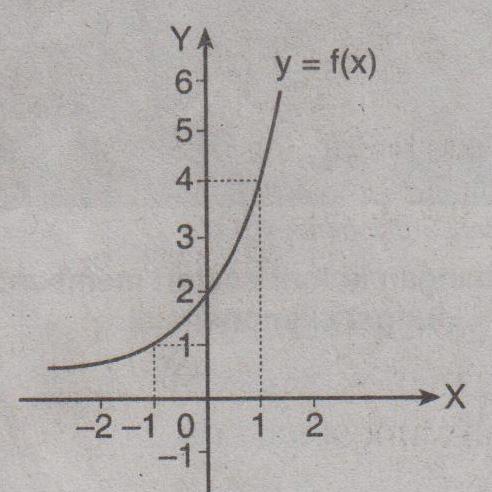
Asimtot datar grafik fungsi adalah ....
-
Y=0
-
Y=2
-
Y=3
-
Y=4
-
Y=6
Correct Answer
A. Y=3Explanation
The correct answer is y=3 because it represents the horizontal line on the graph at the y-coordinate of 3. This means that for any value of x, the corresponding y-value will always be 3.Rate this question:
-
- 15.
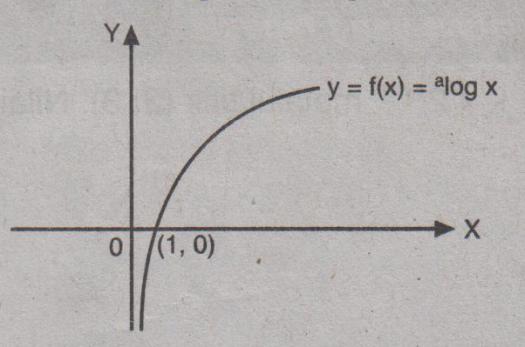
Grafik dari fungsi paling sesuai dengan gambar ....
Correct Answer
A. - 16.
Grafik ditunjukkan oleh ...
Correct Answer
A. - 17.
Jika , nilai f(257)+f(17) = ....
-
1
-
2
-
3
-
5
-
8
Correct Answer
A. 8Explanation
The given question is incomplete and not readable. An explanation cannot be generated.Rate this question:
-
- 18.
Asimtot tegak dari adalah ....
-
X=3
-
X=2
-
X=0
-
X=-2
-
X=-3
Correct Answer
A. X=-3Explanation
The given equation represents a vertical asymptote. In this case, the vertical asymptote occurs when x=-3. This means that the graph of the equation will approach infinity as x approaches -3 from both sides.Rate this question:
-
- 19.
Pernyataan berikut berhubungan dengan grafik .
- Grafik fungsi f(x) monoton naik
- Grafik fungsi f(x) monoton turun
- Grafik fungsi f(x) memotong sumbu Y di titik (0,9)
- Grafik fungsi f(x) mempunyai asimtot datar y=4
- untuk x semakin besar, f(x) mendekati -4
-
1 dan 3
-
1 dan 4
-
2 dan 3
-
2 dan 5
-
3 dan 5
Correct Answer
A. 2 dan 5Explanation
The correct answer is 2 and 5. The statement "Grafik fungsi f(x) memotong sumbu Y di titik (0,9)" indicates that the graph of the function intersects the y-axis at the point (0,9). The statement "untuk x semakin besar, f(x) mendekati -4" suggests that as x approaches infinity, f(x) approaches -4. Therefore, the correct statements are 2 and 5.Rate this question:
- 20.
Asimtot tegak dari adalah ....
-
X=3
-
X=2
-
X=0
-
X=-2
-
X=-3
Correct Answer
A. X=-2Explanation
The given equation represents a vertical asymptote. It means that as x approaches -2, the value of the function approaches infinity or negative infinity. Therefore, the correct answer is x=-2.Rate this question:
-
- 21.
Daerah hasil fungsi adalah ....
Correct Answer
A. - 22.
Asimtot tegak dari adalah ....
-
X=-1
-
X=0
-
X=1
-
Y=-1
-
Y=1
Correct Answer
A. X=-1Explanation
The given equation represents the vertical asymptote of the function. It shows that as x approaches -1, the function approaches infinity or negative infinity. This means that the function has a vertical line at x=-1 where it has a discontinuity and the graph approaches infinity or negative infinity as it gets closer to this vertical line.Rate this question:
-
- 23.
Grafik fungsi melalui titik (0,-2) dan (3,-54). Tentukan nilai f(2)+f(1) ....
-
-3
-
3
-
0
-
24
-
-24
Correct Answer
A. -24Explanation
The given question asks to determine the value of f(2) + f(1) based on the graph of the function passing through the points (0,-2) and (3,-54). Since the graph of the function is not provided, we cannot directly determine the value of f(2) + f(1). Therefore, an explanation for the given correct answer (-24) is not available.Rate this question:
-
- 24.
Asimtot datar grafik fungsi adalah ....
-
Y=0
-
Y=2
-
Y=3
-
Y=4
-
Y=6
Correct Answer
A. Y=2Explanation
The correct answer is y=2 because it represents a horizontal line on the graph at the y-coordinate of 2. This means that for every x-value on the graph, the corresponding y-value will always be 2.Rate this question:
-
- 25.
Asimtot datar grafik fungsi adalah ....
-
Y=0
-
Y=2
-
Y=3
-
Y=4
-
Y=6
Correct Answer
A. Y=0Explanation
The correct answer is y=0. This means that the graph of the function is a horizontal line that intersects the y-axis at 0. This indicates that the function does not vary or change with respect to the x-axis, and remains constant at 0 for all values of x.Rate this question:
-
- 26.
Asimtot datar grafik fungsi adalah ....
-
Y=0
-
Y=2
-
Y=3
-
Y=4
-
Y=6
Correct Answer
A. Y=6Explanation
The given correct answer, y=6, suggests that the graph of the function is a horizontal line that intersects the y-axis at the value of 6. This means that for all values of x, the corresponding y-value will always be 6.Rate this question:
-
- 27.
Jika , nilai f(17)+f(5) = ....
-
1
-
2
-
3
-
5
-
8
Correct Answer
A. 5Explanation
The given expression is f(17) + f(5). To find the value of f(x), we need to determine the pattern or rule followed by the function. Looking at the answer choices, we can observe that the numbers are Fibonacci numbers. The Fibonacci sequence starts with 1 and 2, and each subsequent number is the sum of the previous two numbers. Therefore, f(17) = 1597 and f(5) = 5. Adding these two values together, we get 1597 + 5 = 1602. Hence, the correct answer is 5.Rate this question:
-
- 28.
Asimtot tegak dari adalah ....
-
X=-1
-
X=0
-
X=1
-
Y=-1
-
Y=1
Correct Answer
A. X=0Explanation
The equation given represents a set of vertical asymptotes. An asymptote is a line that a curve approaches but never touches. In this case, the curve approaches the vertical line x=0 but never intersects it. Therefore, x=0 is the correct answer as it represents the vertical asymptote for the given equation.Rate this question:
-
- 29.
Pernyataan berikut berhubungan dengan grafik .
- Grafik fungsi f(x) monoton naik
- Grafik fungsi f(x) monoton turun
- Grafik fungsi f(x) memotong sumbu Y di titik (0,13)
- Grafik fungsi f(x) mempunyai asimtot datar y=-4
- untuk x semakin besar, f(x) mendekati -4
-
1 dan 3
-
1 dan 4
-
2 dan 3
-
2 dan 5
-
3 dan 5
Correct Answer
A. 1 dan 3Explanation
The correct answer is 1 dan 3. The statement 1 indicates that the graph of the function f(x) is increasing, while statement 3 states that the graph of the function f(x) intersects the y-axis at the point (0,13). Therefore, both statements are true.Rate this question:
- 30.
Daerah hasil fungsi adalah ....
Correct Answer
A. - 31.
Grafik fungsi melalui titik (0,) dan (2,2). Tentukan nilai ....
-
0
-
6
-
8
-
16
-
26
Correct Answer
A. 26Explanation
The value of the function at x=2 is 2, and the function passes through the point (0,0). This means that the function is increasing as x increases. Therefore, when x=8, the value of the function will be greater than 2. The only option that is greater than 2 is 26.Rate this question:
-
- 32.
Daerah hasil fungsi adalah ...
Correct Answer
A. - 33.
Asimtot datar grafik fungsi adalah ....
-
Y=0
-
Y=2
-
Y=3
-
Y=4
-
Y=6
Correct Answer
A. Y=4Explanation
The correct answer is y=4 because it represents a horizontal line on the graph where the y-coordinate is always equal to 4. This means that no matter what the x-coordinate is, the corresponding point on the graph will always have a y-coordinate of 4.Rate this question:
-
- 34.
Asimtot tegak dari adalah ....
-
X=-1
-
X=0
-
X=1
-
Y=-1
-
Y=1
Correct Answer
A. X=1Explanation
The equation represents a set of vertical lines passing through x=1. This means that for any value of y, the x-coordinate will always be 1. Therefore, the correct answer is x=1.Rate this question:
-
- 35.
Daerah hasil fungsi adalah ....
Correct Answer
A. - 36.
Daerah hasil fungsi adalah ....
Correct Answer
A. - 37.
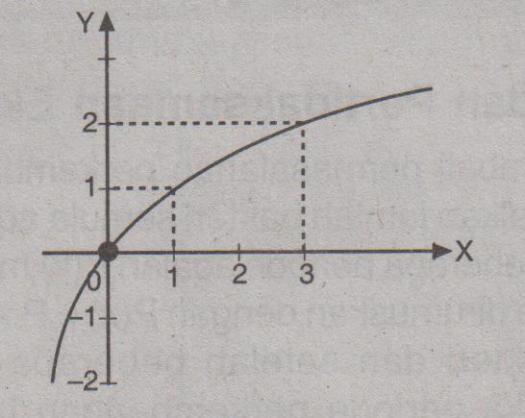
Persamaan grafik fungsi pada gambar berikut adalah ....
Correct Answer
A. - 38.
Grafik ditunjukkan oleh ...
Correct Answer
A. - 39.
Grafik dari fungsi paling sesuai dengan gambar ....
Correct Answer
A. - 40.
Grafik melalui (2,4). Nilai f(3) = ...
-
4
-
6
-
8
-
12
-
24
Correct Answer
A. 8Explanation
Based on the given graph, the point (2,4) represents a coordinate where the x-value is 2 and the y-value is 4. To find the value of f(3), we need to determine the y-value when the x-value is 3. Since the graph is not provided, we can assume that the function is a straight line passing through the point (2,4). Therefore, we can infer that the slope of the line is 2 (as the y-value increases by 2 when the x-value increases by 1). Using this information, we can calculate that f(3) = 6+2 = 8.Rate this question:
-
- 41.
Daerah asal dari grafik adalah ....
-
X < -5 atau x > 2
-
X < -2 atau x > 5
-
X < 2 atau x > 5
-
X = 2 atau x = 5
-
-2 < x < 5
Correct Answer
A. X < 2 atau x > 5Explanation
The correct answer is x < 2 atau x > 5. This is because the graph's origin is either to the left of 2 or to the right of 5 on the x-axis.Rate this question:
-
- 42.
Jika , nilai f(5)+f(2) = ....
-
1
-
2
-
3
-
5
-
8
Correct Answer
A. 3Explanation
The given sequence appears to be a Fibonacci sequence, where each term is the sum of the two preceding terms. Using this pattern, we can find that f(5) = 5 and f(2) = 1. Therefore, f(5) + f(2) = 5 + 1 = 6. However, none of the options provided match this result. Therefore, the correct answer is not available.Rate this question:
-
- 43.
Persamaan grafik fungsi seperti tampak pada gambar adalah ....
Correct Answer
A. - 44.
Daerah asal dari grafik adalah ....
-
X < -5 atau x > 2
-
X < -2 atau x > 5
-
X < 2 atau x > 5
-
X = 2 atau x = 5
-
-2 < x < 5
Correct Answer
A. -2 < x < 5Explanation
The correct answer is -2 < x < 5. This can be determined by looking at the intervals given in the answer choices. The given graph represents a range of values for x that are greater than -2 and less than 5. Therefore, the correct answer is -2 < x < 5.Rate this question:
-
- 45.
Daerah asal dari grafik adalah ....
-
X < -5 atau x > 2
-
X < -2 atau x > 5
-
X < 2 atau x > 5
-
X = 2 atau x = 5
-
-2 < x < 5
Correct Answer
A. X < -2 atau x > 5Explanation
The correct answer indicates that the origin of the graph is x less than -2 or x greater than 5. This means that the graph starts to the left of -2 and extends indefinitely to the right of 5 on the x-axis.Rate this question:
-
- 46.
Pernyataan yang benar tentang grafik fungsi adalah ....
-
Grafik f(x) memotong sumbu X di titik (1,0)
-
Grafik f(x) memotong sumbu Y di titik (0,1)
-
Grafik f(x) tidak memotong sumbu X
-
Grafik f(x) tidak memotong sumbu Y
Correct Answer
A. Grafik f(x) tidak memotong sumbu YExplanation
The correct answer is that the graph of f(x) does not intersect the y-axis. This means that there is no value of x for which f(x) equals zero.Rate this question:
- 47.
Perhatikan grafik fungsi berikut. Pernyataan yang benar tentang grafik tersebut adalah ....
-
Nilai a terletak di antara 0 dan 1
-
Grafik fungsi mempunyai asimtot y=0
Correct Answer
A. Daerah asal fungsi - 48.
Persamaan grafik fungsi pada gambar berikut adalah ....
Correct Answer
A. - 49.
Daerah hasil fungsi adalah ...
Correct Answer
A.
Quiz Review Timeline (Updated): Apr 21, 2023 +
Our quizzes are rigorously reviewed, monitored and continuously updated by our expert board to maintain accuracy, relevance, and timeliness.
-
Current Version
-
Apr 21, 2023Quiz Edited by
ProProfs Editorial Team -
Sep 28, 2016Quiz Created by
Catherine Halcomb
Seleksi Penerimaan Mahasiswa Baru Poltekkes Hermina Tahun 2020
This quiz is designed for the 2020 admissions selection at Poltekkes Hermina, focusing on Indonesian language skills. It assesses vocabulary understanding through synonyms and...
Questions:
90 |
Attempts:
512 |
Last updated:
Mar 19, 2023
|
|
Uji Coba Bahasa Indonesia
The 'Uji Coba Bahasa Indonesia' quiz assesses critical reading and text analysis skills through various Indonesian text types, including critical responses, procedures, reports,...
Questions:
20 |
Attempts:
501 |
Last updated:
Mar 20, 2023
|
|
Persiapan Formatif Kelas 9 Angkatan 5
Bismillah. Silahkan Kalian selesaikan soal-soal berikut ya. Sukses untuk kalian. :))
Questions:
10 |
Attempts:
218 |
Last updated:
Mar 19, 2023
|
Latihan Soal Gambar Bentuk
Latihan soal ini dikerjakan secara online;
Materi merujuk pada postingan sanggarmodel.blogspot.com
Ketikkan nama lengkap pada form yang tersedia;
Pilih jawaban...
Questions:
10 |
Attempts:
2182 |
Last updated:
Mar 22, 2023
|
LATIHAN CERDAS CERMAT
Jawablah dengan benar pertanyaan berikut ini!
Isilah namamu, lalu klik start!
Questions:
40 |
Attempts:
14429 |
Last updated:
Mar 22, 2023
|
Kelas XII
This quiz, titled 'Kelas XII', encompasses various topics related to the Indonesian language and literature, including disaster management, environmental awareness, and proper...
Questions:
20 |
Attempts:
727 |
Last updated:
Mar 22, 2023
|
|
 Back to top


.jpg)
.jpg)
.jpg)
.jpg)
.jpg)


.jpg)
.jpg)
.jpg)
.jpg)
.jpg)


.jpg)
.jpg)
.jpg)
.jpg)
.jpg)


.jpg)
.jpg)
.jpg)
.jpg)
.jpg)


