CSQA Prep - Chapter 4 - Quality Assurance

32 Questions | Attempts: 425
Share

SettingsSettingsSettings
CSQA Prep - Chapter 4 - Quality Assurance - Quiz

Quiz on topics covered in the CSQA Chapter 4 on Quality Assurance.


Questions and Answers
  • 1. 
    The four variables of the project are: (select all that apply) (4-2)
    • A. 

      Scope

    • B. 

      Schedule

    • C. 

      Cost

    • D. 

      Resources

    • E. 

      Quality

  • 2. 
    The key concept to establishing a quality function is establishing the need for _______. (4-2)
  • 3. 
    The ultimate responsibility for quality rests with _______  ___________. (4-2)
  • 4. 
    The Organizational Readiness Matrix represents: (4-2)
    • A. 

      How ready the organization and people are

    • B. 

      How ready the organization is and how good a sales job the quality organization can do

    • C. 

      How ready are the people and their skills

  • 5. 
    Three Phases of Quality Function Maturation The maturation of the quality management system can be divided into three phases: (choose all that apply) (4-5)
    • A. 

      Mature

    • B. 

      Initial

    • C. 

      Intermediate

    • D. 

      Final

    • E. 

      Growth

  • 6. 
    The initial phase is: (4-5)
    • A. 

      Where an organization's objectives move from control to assurance. The emphasis is on defining, stabilizing, measuring, and improving work processes.

    • B. 

      Objectives such as consulting, motivating, and benchmarking move the organization toward optimization.

    • C. 

      Considered the formalization of quality control activities. An organization in this phase is results-driven, focusing on defining and controlling product quality.

  • 7. 
    The intermediate phase is: (4-6)
    • A. 

      Where an organization's objectives move from control to assurance. The emphasis is on defining, stabilizing, measuring, and improving work processes.

    • B. 

      Objectives such as consulting, motivating, and benchmarking move the organization toward optimization.

    • C. 

      Considered the formalization of quality control activities. An organization in this phase is results-driven, focusing on defining and controlling product quality.

  • 8. 
    The two major drivers that change the role of the QA analyst are: (4-7)
    • A. 

      Organizational definition of quality assurance

    • B. 

      Management philosophy used in the IT group

    • C. 

      Capability maturity of the QA organization

    • D. 

      Personal belief system of managers

  • 9. 
    Which of the following is not a step for implementing an IT quality function? (4-10)
    • A. 

      Locate organizationally the IT quality function

    • B. 

      Build and deploy the quality toolbox

    • C. 

      Identify the quality manager

    • D. 

      Determine the quality methodology

  • 10. 
    From the choices below, select all elements that should be included in an IT Quality Plan? (4-19)
    • A. 

      The mission, giving a detailed description of what business IT is in

    • B. 

      Long-term IT goals giving direction for IT in the next five years

    • C. 

      Short-term objectives for the next business year

    • D. 

      Budget projections to support operation of quality operations

    • E. 

      Organizational renewal programs that will assure the long-range success of the organization

  • 11. 
    The CSQA CBOK focuses upon three catagories of quality tools.  They are: __________, _________ and ________ tools. (4-23)
  • 12. 
    Which of the following are characteristics of Brainstorming?(4-25) Please select all that apply.
    • A. 

      Quickly generate a quantity of creative or original ideas

    • B. 

      Structured approach to solicit input in an orderly manner

    • C. 

      All participants have equal opportunity to participate

    • D. 

      No idea is insigificant and no criticism is offered

  • 13. 
    Which of the following is a structured, facilitated approach to rank ideas, issues, concerns and solutions? (4-26)
    • A. 

      Cause-and-Effect Diagram

    • B. 

      Nominal Group Technique

    • C. 

      Affinity Diagram

    • D. 

      Force Field Analysis

  • 14. 
    Which diagram is an orderly extension of a structured brainstorming session that categorizes a large number of ideas? (4-25)
    • A. 

      Cause-and-Effect Diagram

    • B. 

      Nominal Group Technique

    • C. 

      Affinity Diagram

    • D. 

      Force Field Analysis

  • 15. 
    Which diagram helps visualize, clarify, link, identify, and classify possible causes of problems, products, and services? (4-27)
    • A. 

      Cause-and-Effect Diagram

    • B. 

      Nominal Group Technique

    • C. 

      Affinity Diagram

    • D. 

      Force Field Analysis

  • 16. 
    A visual tool used to determine and understand factors that drive and restrain change is called? (4-29)
    • A. 

      Cause-and-Effect Diagram

    • B. 

      Nominal Group Technique

    • C. 

      Affinity Diagram

    • D. 

      Force Field Analysis

  • 17. 
    __________ is the process of determining how well a company's products, services, and practices measure up against others.
  • 18. 
    Select all of the following that are types of benchmarking identified in the CSQA CBOK? (4-32)
    • A. 

      Cost

    • B. 

      Process

    • C. 

      Time

    • D. 

      Performance

    • E. 

      Product

  • 19. 
    Please select all statements which are applicable about Quality Function Deployment (QFD)? (4-35)
    • A. 

      An organized approach to quality with tools, techniques and a set of methods.

    • B. 

      Dr. Yoji Akao is the principal developer of QFD

    • C. 

      Comprehensive quality deployment includes quality deployment, technology deployment, cost/schedule deployment and reliability deployment.

  • 20. 
    A graph that groups data by predetermined intervals to show the frequency of a data set is called? (4-41)
    • A. 

      Pareto

    • B. 

      Histogram

    • C. 

      Run Chart

    • D. 

      Scatter Plot

    • E. 

      Control Chart

  • 21. 
    This graph is used when there is a need to order or rank problems or causes by frequency. (4-43)
    • A. 

      Pareto

    • B. 

      Histogram

    • C. 

      Run Chart

    • D. 

      Scatter Plot

    • E. 

      Control Chart

  • 22. 
    This chart provides a way of objectively defining a process and variation. (4-45)
    • A. 

      Pareto

    • B. 

      Histogram

    • C. 

      Run Chart

    • D. 

      Scatter Plot

    • E. 

      Control Chart

  • 23. 
    A graph of data in chronological order that displays changes and trends in the central tendency average is called a ____ _____. (4-44)
  • 24. 
    A scatter plot shows the relationship of two variables by showing how one variable ________ the other. (4-47)
  • 25. 
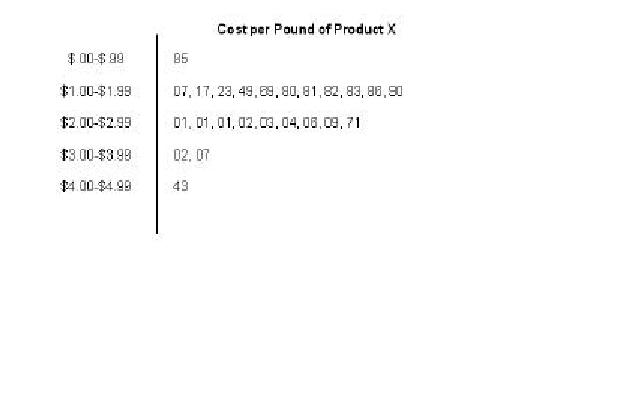
    This is an example of a: (4-52)
    • A. 

      Bar Chart

    • B. 

      Stem-and-Leaf Chart

    • C. 

      Pie Chart

    • D. 

      Line Chart

Related Topics

Back to Top Back to top
×

Wait!
Here's an interesting quiz for you.

We have other quizzes matching your interest.