What Type Of Graph Should You Use?


-
The favourite subjects of boys and girls separately:
-
Column graph
-
Double column graph
-
Histogram
-

This is the quiz for APC students studying graphing and Statistics. Put a checkmark in the box for the type of graph you would use for the data given.

Quiz Preview
- 2.
Colours of smarties:
-
Column graph
-
Double column graph
-
Histogram
Correct Answer
A. Column graphExplanation
A column graph is the most suitable representation for the colours of smarties because it allows for easy comparison between different categories (in this case, different colours of smarties). Each colour can be represented by a separate column, and the height of the column can represent the frequency or quantity of that particular colour. This visual representation helps in quickly understanding the distribution of colours and identifying any patterns or trends. A double column graph or histogram may not be as appropriate as they are typically used for different types of data analysis.Rate this question:
-
- 3.
The cost of five items in Australia and the cost of the same five items in the UK:
-
Column graph
-
Double column graph
-
Histogram
Correct Answer
A. Double column graphExplanation
A double column graph is the most suitable type of graph to compare the cost of five items in Australia and the UK. This graph allows for a clear visual representation of the data by using two columns for each item, one representing the cost in Australia and the other representing the cost in the UK. This allows for easy comparison between the two countries and makes it easier to identify any differences or similarities in the cost of the items.Rate this question:
-
- 4.
Heights of students in cm:
-
Column graph
-
Double column graph
-
Histogram
Correct Answer
A. HistogramExplanation
A histogram is the most appropriate choice for representing the heights of students in cm because it is a graphical representation that displays the distribution of a continuous variable. In this case, the heights of students can be categorized into different bins or intervals, and the frequency or number of students falling within each interval can be represented by the height of the bars. This allows us to easily visualize the distribution of heights and identify any patterns or trends. A column graph or double column graph may not be suitable as they are typically used for comparing discrete categories or groups, rather than representing a continuous variable like height.Rate this question:
-
- 5.
How many siblings students have:
-
Column graph
-
Double column graph
-
Histogram
Correct Answer
A. Column graphExplanation
A column graph is a type of chart that uses vertical bars to represent data. Each bar represents a category, in this case, the number of siblings students have. The height of the bar corresponds to the frequency or count of students in each category. This type of graph is suitable for comparing the number of siblings among different groups or categories. It provides a clear visual representation of the data and allows for easy comparison between categories.Rate this question:
-
- 6.
How many songs you have on iTunes:
-
Column graph
-
Double column graph
-
Histogram
Correct Answer
A. HistogramExplanation
A histogram is the most appropriate type of graph to represent the number of songs on iTunes because it allows for the display of the frequency distribution of the data. In this case, the histogram would have the number of songs on the x-axis and the frequency (or count) of each number of songs on the y-axis. This would provide a visual representation of how many songs are present in different ranges or categories, allowing for easy comparison and analysis of the data.Rate this question:
-
Quiz Review Timeline (Updated): Aug 12, 2024 +
Our quizzes are rigorously reviewed, monitored and continuously updated by our expert board to maintain accuracy, relevance, and timeliness.
-
Current Version
-
Aug 12, 2024Quiz Edited by
ProProfs Editorial Team -
May 16, 2011Quiz Created by
AlisonWerstuk
Descriptive And Inferential Statistics Quiz
Ready to test your knowledge of statistics? Take our Descriptive and Inferential Statistics Quiz to brush up on your understanding of data analysis. Whether you're a beginner...
Questions:
10 |
Attempts:
2558 |
Last updated:
Mar 22, 2024
|
Decoding Uncertainty: A Bayesian Probability Quiz
Challenge your basics of probability and uncertainty with our "Decoding Uncertainty: A Bayesian Probability Quiz." Dive into the fascinating realm of Bayesian...
Questions:
10 |
Attempts:
120 |
Last updated:
Nov 30, 2023
|
Quiz: Which Statistical Character Are You?
Unleash your inner data persona with our Statistical Character Quiz! This quiz is designed to help you discover your statistical alter ego. Dive into these engaging questions that...
Questions:
10 |
Attempts:
253 |
Last updated:
Nov 30, 2023
|
Correlation Study In Statistical Analysis Quiz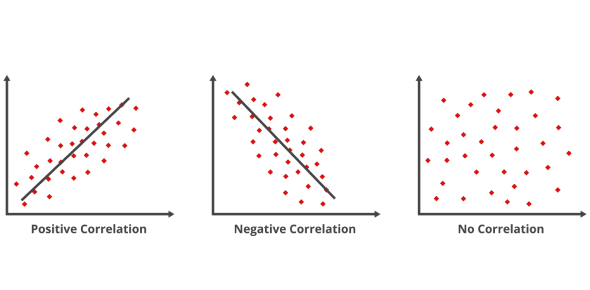
The correlations study in statistical analysis measures the possibility of a relationship between the two statistical datasets. It's an essential aspect of statistical...
Questions:
10 |
Attempts:
1104 |
Last updated:
Dec 20, 2023
|
Name Every Batter With A Test Century In 2022
Are you a true fan of Cricket? It is time to test your memory. In this quiz, you need to name every batter with a test century in 2022. If you have been following all the test...
Questions:
10 |
Attempts:
233 |
Last updated:
Nov 16, 2023
|
Summative #1 (Introduction To Statistics And Probability)
Choose the correct classification of each statement or variables below
Questions:
25 |
Attempts:
444 |
Last updated:
Dec 17, 2024
|
 Back to top