Microsoft Excel 2007 Analysis Trivia Quiz

Reviewed by Editorial Team
The ProProfs editorial team is comprised of experienced subject matter experts. They've collectively created over 10,000 quizzes and lessons, serving over 100 million users. Our team includes in-house content moderators and subject matter experts, as well as a global network of rigorously trained contributors. All adhere to our comprehensive editorial guidelines, ensuring the delivery of high-quality content.
Learn about Our Editorial Process
| By Cburke14
C
Cburke14
Community Contributor
Quizzes Created: 1 | Total Attempts: 482
| Attempts: 482 | Questions: 54
Please wait...
Question 1 / 54
0 %
0/100
Score 0/100
1. The process of hiding certain records and viewing the ones you want is called ____________ your data.

Explanation

Filtering refers to the process of selectively hiding certain records and displaying only the desired ones in a dataset. It allows users to narrow down the information they are viewing by applying specific criteria or conditions to the data. By filtering data, users can easily focus on relevant information and remove any unnecessary or unwanted records, making it easier to analyze and work with the dataset.

Submit
Please wait...
About This Quiz
Microsoft Excel 2007 Analysis Trivia Quiz - Quiz

This Microsoft Excel 2007 Analysis Trivia quiz assesses knowledge on function usage, filtering criteria, PivotTable management, and chart analysis. Ideal for learners aiming to enhance their Excel skills and understanding of data analysis tools.

Personalize your quiz and earn a certificate with your name on it!
2. An easy way to sort data when there is only one sort field is to use the Sort A to Z or Sort Z to A buttons.

Explanation

Using the Sort A to Z or Sort Z to A buttons is indeed an easy way to sort data when there is only one sort field. These buttons allow the user to arrange the data in ascending (A to Z) or descending (Z to A) order based on the selected field. This simplifies the sorting process and saves time compared to manually rearranging the data. Therefore, the given answer "True" is correct.

Submit
3. A _______________ is an excel document.

Explanation

A workbook is a term used to describe an excel document. It refers to a file that contains multiple worksheets or spreadsheets where data can be organized and manipulated. Workbooks are used to store and analyze data, perform calculations, and create charts and graphs. They provide a structured and organized way to manage and present information in a tabular format.

Submit
4. Multiplication before addition is an example of ____________________

Explanation

Multiplication before addition is an example of the order of operations. The order of operations is a set of rules that dictate the sequence in which mathematical operations should be performed in an expression. According to this rule, multiplication should be performed before addition. This ensures that the mathematical expression is evaluated correctly and consistently.

Submit
5. A named operation that returns a value is a ______.

Explanation

A named operation that returns a value is called a function. Functions are blocks of code that can be executed by calling their name and can perform specific tasks or calculations. They can take input parameters and produce output values, making them useful for organizing and reusing code. By using functions, programmers can break down complex tasks into smaller, more manageable parts, improving the efficiency and readability of their code.

Submit
6. In PivotTable terminology, the fields that you summarize are known as ______________ fields.

Explanation

In PivotTable terminology, the fields that you summarize are known as "value" fields. This term refers to the specific data that is being summarized or aggregated in the PivotTable. The value field is the one that provides the numerical or quantitative information that is used to calculate totals, averages, or other summary statistics in the PivotTable.

Submit
7. When you are in _________ mode, some keyboard shortcuts will work differently.

Explanation

When you are in editing mode, some keyboard shortcuts will work differently. This means that the functionality of certain keyboard shortcuts will be altered or modified when you are actively editing a document or file. It implies that the keyboard shortcuts that are typically used in other modes or situations may not have the same effect or perform the same actions when you are in editing mode.

Submit
8. The simplest and most convenient way to add a record to a table is to enter the data in the first blank row.

Explanation

The statement is true because when adding a record to a table, it is common practice to enter the data in the first blank row. This ensures that the data is added in a sequential and organized manner, making it easier to retrieve and analyze the information later on. Additionally, entering the data in the first blank row helps to maintain the integrity and consistency of the table structure.

Submit
9. A conditional format can make negative numbers red and positive numbers black.

Explanation

A conditional format is a formatting rule that changes the appearance of a cell or range of cells based on a specified condition. In this case, the condition is whether the number is positive or negative. If the number is negative, the conditional format will make it red, and if it is positive, it will remain black. Therefore, the statement is true.

Submit
10. The function arguments dialog box tells you how to use functions.

Explanation

The function arguments dialog box provides information on how to use functions. It likely includes details such as the number and types of arguments the function expects, as well as any additional parameters or options that can be used. This dialog box is a helpful tool for understanding and correctly using functions in a program or software. Therefore, the statement is true.

Submit
11. You can create at most one Excel table in a worksheet

Explanation

In Excel, you can create multiple tables in a single worksheet. Tables are a powerful feature that allows you to organize and analyze data more efficiently. By converting a range of data into a table, you gain access to various table-specific functionalities, such as sorting, filtering, and using structured references. This can be particularly useful when working with large datasets or when you need to perform complex calculations or analysis on your data. Therefore, the statement that you can create only one Excel table in a worksheet is false.

Submit
12. The simplest and most convenient way to add a record to a table is to enter the data in the first blank row below the last record.

Explanation

The statement is true because adding a record to a table by entering the data in the first blank row below the last record is indeed the simplest and most convenient way. This ensures that the new record is placed in the correct order and maintains the integrity of the table structure. By doing so, it is easy to keep track of the records and maintain the organization of the table.

Submit
13. If you insert a new row at the top of the table, the new row becomes the header row and is formatted with the table style.

Explanation

When a new row is inserted at the top of a table, it becomes the header row and is automatically formatted with the table style. This means that the new row will have the same formatting as the rest of the table, such as font style, color, and borders. This is a useful feature as it ensures consistency and makes the table visually appealing. Therefore, the statement "True" is correct.

Submit
14. A group of worksheet cells is called a _________.

Explanation

A group of worksheet cells is called a range. A range is a collection of cells that are adjacent to each other or selected together. It can include a single cell or multiple cells, and is often used to perform calculations or apply formatting to a specific set of cells in a worksheet.

Submit
15. When you clear a filter, all filters in the worksheet are cleared

Explanation

When you clear a filter, only the specific filter that you cleared is cleared. The other filters in the worksheet remain unaffected and will still be applied to the data. Therefore, the given statement is false.

Submit
16. A chart that combines two or more chart types into a single graph is called a(n) _____________ chart.

Explanation

A chart that combines two or more chart types into a single graph is called a combination chart. This type of chart is useful when you want to display different types of data or variables together in one visual representation. By combining different chart types, such as line charts, bar charts, or pie charts, you can effectively present complex data sets and highlight relationships or patterns between different variables. The combination chart allows for a comprehensive and visually appealing way to present multiple types of information simultaneously.

Submit
17. The Paste Options button allows you to________.

Explanation

The Paste Options button allows you to perform multiple actions, including keeping the source formatting, copying formatting only, and copying values only. This means that you can choose to paste the content with its original formatting, paste only the formatting without the content, or paste only the values without any formatting. Therefore, the correct answer is "all of the above" as it encompasses all the possible actions that can be performed using the Paste Options button.

Submit
18. When a worksheet is printed, the grid lines that surround the cells are printed by default.

Explanation

When a worksheet is printed, the grid lines that surround the cells are not printed by default. This means that when you print a worksheet, the grid lines will not be visible on the printed copy unless you specifically choose to include them.

Submit
19. The ____________________ criteria filter requires that the records displaying begin with the specified text string.

Explanation

The "begins with" criteria filter is used to display records that start with a specific text string. This means that only the records that have the specified text string at the beginning will be shown, while any records that have the text string in the middle or at the end will be excluded.

Submit
20. When you copy a range of cells, you must press the _____ key while you drag the selection to its new location.

Explanation

When you copy a range of cells, you must press the Ctrl or control key while you drag the selection to its new location. This key combination allows you to duplicate the selected cells and place them in a different location without removing the original data. By holding down the Ctrl or control key, you can easily copy and paste the selected cells to another part of the spreadsheet.

Submit
21. After Excel displays an existing entry in the column that matches the characters you type, press the ______ key to accept the entry

Explanation

When Excel displays an existing entry in the column that matches the characters you type, pressing the Tab key will accept the entry. The Tab key is commonly used to move between cells in Excel, and in this case, it is used to confirm and accept the displayed entry as the desired input.

Submit
22. I the background color for a workbook is green, what color should you not use for any of the font or highlight colors?

Explanation

If the background color for a workbook is green, using the color red for any of the font or highlight colors would create poor visibility and contrast. Red and green are complementary colors, meaning they are opposite each other on the color wheel. When used together, they can create visual discomfort and make it difficult to read or distinguish the text. Therefore, it is advisable not to use red as a font or highlight color in this scenario.

Submit
23. The  ___________ allows you to use excel to change one or more values in a spreadsheet and then assess the effect those changes have on the calculated values.

Explanation

What-if analysis, also known as what if analysis, is a feature in Excel that allows users to change one or more values in a spreadsheet and observe the impact of those changes on the calculated values. It is a useful tool for scenario planning and decision-making, as it enables users to explore different possibilities and evaluate the potential outcomes. By performing what-if analysis, users can gain insights into how changes in variables can affect the overall results and make informed decisions based on the data.

Submit
24. The ____________ displays the cell reference of the active cell.

Explanation

The name box in Excel displays the cell reference of the active cell. This allows users to easily identify and keep track of the specific cell they are working on. By showing the cell reference, it helps users navigate and locate cells within the spreadsheet.

Submit
25. What is a workbook made up of?

Explanation

A workbook is made up of one or more worksheets. Worksheets are individual pages within a workbook that contain data, formulas, and other elements. They allow users to organize and manipulate data in a structured manner. By including multiple worksheets in a workbook, users can create a comprehensive collection of related data and analysis.

Submit
26. A(n) _______________ is a range of values that spans the vertical axis in a column chart.

Explanation

In a column chart, a scale is a range of values that spans the vertical axis. It helps to represent the data accurately and proportionally by dividing the vertical axis into equal intervals. The scale allows viewers to interpret the height of each column and compare the values effectively. Without a scale, the chart would lack context and make it difficult to understand the data being presented.

Submit
27. A field name is also called a(n)  _____________

Explanation

A field name is also called a column header because it is the title or label given to a column in a table or spreadsheet. It identifies the type of data that is stored in that particular column and helps users understand the information presented in the table. The column header serves as a reference point for organizing and analyzing data, allowing users to easily navigate and manipulate the information within the table.

Submit
28. With the Last Quarter criteria filter, quarters are defined as, for example_________.

Explanation

The Last Quarter criteria filter defines quarters as April, May, and June.

Submit
29. The Insert Function dialog box tells you how to use functions.

Explanation

It gives you a list of the functions and all of their categories.

Submit
30. You can use a table's sizing handle to add columns or rows to a table

Explanation

A table's sizing handle can be used to add columns or rows to a table. This feature allows users to easily modify the structure of a table by simply dragging the sizing handle to increase the number of rows or columns. By using this functionality, users can quickly adjust the size and layout of a table to accommodate their specific needs.

Submit
31. If there are too many numbers after the decimal place displayed in a cell, creating a distraction from the data, you could make the data appear cleaner by:

Explanation

By using the Number group to decrease the number of digits displayed, you can control the precision of the numbers in the cell. This means that you can choose to display only a certain number of decimal places or round the numbers to a specific precision. This will help in making the data appear cleaner and reduce the distraction caused by too many numbers after the decimal place.

Submit
32. When you designate a range as a(n) ______, Excel provides the same operations as are available for a structured range of data

Explanation

When you designate a range as a "Table" in Excel, it provides the same operations as are available for a structured range of data. This means that you can easily filter, sort, and analyze the data within the table. Additionally, tables in Excel have built-in features such as automatic row expansion, column headers, and the ability to easily create formulas that reference the table data. Overall, using a table in Excel helps to organize and manage data effectively.

Submit
33. When using a data bar, changing the value of one cell in the range will not affect the size of all the other cells.

Explanation

When using a data bar, changing the value of one cell in the range will affect the size of all the other cells. This is because data bars are conditional formatting features that visually represent the values in a range of cells by varying the length of the bars. When the value in one cell changes, the length of the data bar for that cell will adjust accordingly, impacting the size of the other cells in the range. Therefore, the correct answer is False.

Submit
34. As a general rule you should______________

Explanation

As a general rule, centering column titles helps to visually distinguish them from the rest of the content and make them stand out. Left aligning the text in the columns ensures that the content is easy to read and scan, as it follows the natural reading pattern. Right aligning the numbers in the columns helps to align them vertically and make it easier to compare and perform calculations.

Submit
35. If you have data that runs across five columns, from column A to column E, one way to center a title across the top of the data would be to:

Explanation

To center a title across the top of the data, you would need to type the data in cell A1 and then merge cells A1 to E1. This will combine the cells into one larger cell, allowing the title to span across all five columns. By merging the cells, the title will be centered horizontally within the merged cell, creating a visually appealing and organized layout for the data.

Submit
36. The _____________ button quickly inserts Excel functions.

Explanation

The AutoSum button is used to quickly insert Excel functions. It automatically selects the range of cells that it believes you want to sum, making it easier and faster to perform calculations. The button is named "AutoSum" and can also be accessed by typing "auto sum" in the function bar.

Submit
37. If you have columns that are truncating your content, but you cannot increase the width of the worksheet and be able to print on one page, a solution for making the test visible without loosing data would be to:

Explanation

The correct answer is to click Wrap text. This option allows the text in the cells to wrap within the cell boundaries, ensuring that all content is visible without truncation. By selecting this option, the text will be displayed on multiple lines within the cell, making it fully readable without losing any data.

Submit
38. Pressing Ctrl + ' switches to the _________ view.

Explanation

Pressing Ctrl + ' switches to the formula view.

Submit
39. You use ______ filters to find all objects with a value greater than X or acquired after a certain date

Explanation

To find all objects with a value greater than X or acquired after a certain date, you would use "criteria" filters. These filters allow you to set specific conditions or requirements for your search, such as filtering objects based on their values or acquisition dates. By applying criteria filters, you can narrow down your search results to only include objects that meet the specified conditions.

Submit
40. When creating an Excel document, you should avoid using ______ text and background together, since this is the most common form of color blindness.

Explanation

Color blindness is a condition in which individuals have difficulty distinguishing certain colors, particularly red and green. Therefore, when creating an Excel document, it is important to avoid using red and green together as text and background colors. This is because individuals with color blindness may not be able to differentiate between the two colors, leading to confusion and difficulty in reading the document.

Submit
41. ___________ view shows the contents of a worksheet.

Explanation

The Normal view in Excel shows the contents of a worksheet without any additional formatting or layout changes. It displays the worksheet in a standard format, allowing users to view and edit the data easily. This view is commonly used for everyday tasks such as data entry, editing, and reviewing the contents of the worksheet.

Submit
42. The _________________ displays the name of the sheets in the workbook.

Explanation

The sheet tabs in a workbook display the names of the sheets. These tabs are located at the bottom of the workbook window and allow users to easily navigate between different sheets within the workbook. By clicking on a specific sheet tab, the user can quickly access and view the contents of that particular sheet.

Submit
43. Removing the contents of a cell is known as ____ a cell.

Explanation

When we remove the contents of a cell, we are essentially clearing it. Clearing a cell means that we are erasing or deleting the data that was previously entered in that cell. This action leaves the cell empty and ready to be filled with new data. Therefore, the correct answer is "clearing".

Submit
44. A(n)_____________________________ includes a series of questions that help you think about the purpose of the workbook and how to achieve your desired results.

Explanation

A planning and analysis sheet is a tool that consists of a series of questions aimed at assisting individuals in considering the purpose of a workbook and determining the steps needed to achieve their desired outcomes. This sheet helps users think critically about their goals and provides a structured framework for effective planning and analysis.

Submit
45. 60%-Accent is an example of a cell _____.

Explanation

The given answer "style" is correct because accent is a characteristic or attribute of a cell that affects its appearance or formatting. Style refers to the visual design or layout of a cell, including aspects such as font, color, alignment, and other formatting options. Therefore, accent can be considered as a style element that enhances the visual appeal or emphasis of a cell.

Submit
46. Once you hide a row, it remains hidden as long as the workbook is active.

Explanation

You can always choose to un-hide it.

Submit
47. To sort data in an Excel worksheet you can use the ______.

Explanation

The correct answer is "Any of the above". This is because all three options mentioned - the Sort A to Z and Sort Z to A buttons, QuickSort Options, and the Sort command on the Formulas tab - can be used to sort data in an Excel worksheet. Depending on the user's preference or the specific requirements of the data, any of these options can be used to sort the data in either ascending or descending order.

Submit
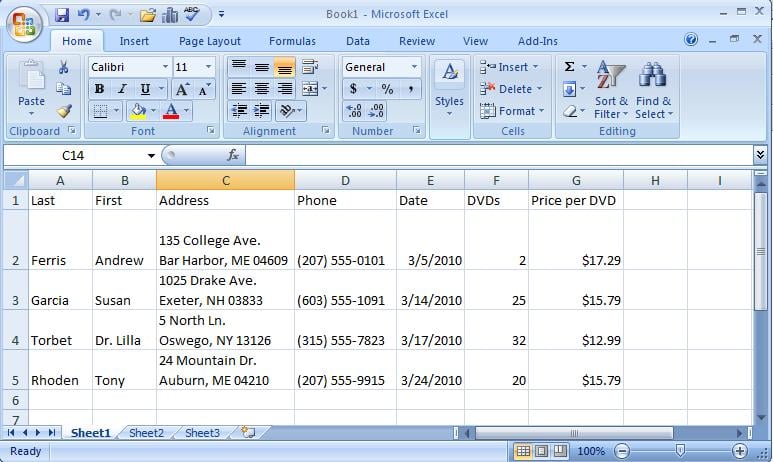
48. None of the data shown is _________.

Explanation

The given answer is "truncated" because the question states that none of the data shown is _________. "Truncated" means that the data has been cut off or shortened, so if none of the data is truncated, it means that all of the data is complete and not cut off. The other options - aligned, formatted, and formulated - do not make sense in the context of data being cut off or shortened.

Submit
49. The amount of money being loaned is known as the _____.

Explanation

The correct answer is "principal". In the context of a loan, the principal refers to the initial amount of money that is being borrowed. It is the original sum that the borrower receives from the lender and is expected to repay over time, along with any interest or fees. The principal amount does not include any additional charges or interest that may be added to the loan.

Submit
50. If you want to use your PivotTable to combine items into groups, which of the following would not be true?

Explanation

In a PivotTable, items that appear as row labels can be grouped. Grouping allows you to combine similar items into categories or ranges. Therefore, the statement "Items that appear as row labels cannot be grouped" is not true.

Submit
51. Item ______ in the figure indicates the fields you want to summarize.

Explanation

In the given figure, the number 4 indicates the fields that you want to summarize.

Submit
52. Put the following five steps in the order in which you would perform them to use the Paste Special function: 1. Select and copy a range 2. Click the Paste button arrow in the Clipboard group 3. Specify exactly what you want to paste 4. Click Paste Special to open the dialog box 5. Select the range where you want to pase the Clipboard contents

Explanation

To use the Paste Special function, the first step is to select and copy a range of cells. Then, click the Paste button arrow in the Clipboard group, which opens a drop-down menu. In this menu, the fourth step is to click Paste Special, which opens a dialog box. In the dialog box, the third step is to specify exactly what you want to paste, such as values, formulas, or formats. Finally, the fifth step is to select the range where you want to paste the contents of the clipboard. Therefore, the correct order of the steps is 1, 5, 2, 3, 4.

Submit
53. A(n) ________ function is conditional.

Explanation

A logic function is conditional because it operates based on logical conditions. It evaluates the truth or falsity of one or more inputs and produces an output based on those conditions. The output of a logic function depends on the values of its inputs, and it follows logical rules such as AND, OR, and NOT. Therefore, a logic function is conditional as it considers different conditions to determine its output.

Submit
54. The most efficient way to format several cells with a specific font, number format, alignment, fon color would be to:

Explanation

The most efficient way to format several cells with a specific font, number format, alignment, and font color would be to use the Format Painter. This tool allows you to copy the formatting from one cell and apply it to multiple cells with just a few clicks. Additionally, applying a table style can also be an efficient way to format cells as it applies a predefined set of formatting options to the selected range of cells.

Submit
View My Results

Quiz Review Timeline (Updated): Mar 22, 2023 +

Our quizzes are rigorously reviewed, monitored and continuously updated by our expert board to maintain accuracy, relevance, and timeliness.

  • Current Version
  • Mar 22, 2023
    Quiz Edited by
    ProProfs Editorial Team
  • May 02, 2012
    Quiz Created by
    Cburke14
Cancel
  • All
    All (54)
  • Unanswered
    Unanswered ()
  • Answered
    Answered ()
The process of hiding certain records and viewing the ones you want is...
An easy way to sort data when there is only one sort field is to use...
A _______________ is an excel document.
Multiplication before addition is an example of ____________________
A named operation that returns a value is a ______.
In PivotTable terminology, the fields that you summarize are known as...
When you are in _________ mode, some keyboard shortcuts will work...
The simplest and most convenient way to add a record to a table is to...
A conditional format can make negative numbers red and positive...
The function arguments dialog box tells you how to use functions.
You can create at most one Excel table in a worksheet
The simplest and most convenient way to add a record to a table is to...
If you insert a new row at the top of the table, the new row becomes...
A group of worksheet cells is called a _________.
When you clear a filter, all filters in the worksheet are cleared
A chart that combines two or more chart types into a single graph is...
The Paste Options button allows you to________.
When a worksheet is printed, the grid lines that surround the cells...
The ____________________ criteria filter requires that the records...
When you copy a range of cells, you must press the _____ key while you...
After Excel displays an existing entry in the column that matches the...
I the background color for a workbook is green, what color should you...
The  ___________ allows you to use excel to change one or more...
The ____________ displays the cell reference of the active cell.
What is a workbook made up of?
A(n) _______________ is a range of values that spans the vertical axis...
A field name is also called a(n)  _____________
With the Last Quarter criteria filter, quarters are defined as, for...
The Insert Function dialog box tells you how to use functions.
You can use a table's sizing handle to add columns or rows to a...
If there are too many numbers after the decimal place displayed in a...
When you designate a range as a(n) ______, Excel provides the same...
When using a data bar, changing the value of one cell in the range...
As a general rule you should______________
If you have data that runs across five columns, from column A to...
The _____________ button quickly inserts Excel functions.
If you have columns that are truncating your content, but you cannot...
Pressing Ctrl + ' switches to the _________ view.
You use ______ filters to find all objects with a value greater than X...
When creating an Excel document, you should avoid using ______ text...
___________ view shows the contents of a worksheet.
The _________________ displays the name of the sheets in the workbook.
Removing the contents of a cell is known as ____ a cell.
A(n)_____________________________ includes a series of questions that...
60%-Accent is an example of a cell _____.
Once you hide a row, it remains hidden as long as the workbook is...
To sort data in an Excel worksheet you can use the ______.
None of the data shown is _________.
The amount of money being loaned is known as the _____.
If you want to use your PivotTable to combine items into groups, which...
Item ______ in the figure indicates the fields you want to summarize.
Put the following five steps in the order in which you would perform...
A(n) ________ function is conditional.
The most efficient way to format several cells with a specific font,...
Alert!

Advertisement