The more I worked with assessments, the more I realized how misleading a single score can be. A grade might capture the outcome, but it rarely explains the journey that led there. Quiz analytics bridge that gap by revealing the patterns behind performance—the moments of hesitation, the overconfidence, and the topics that consistently cause trouble.
Once I began examining this data closely, the numbers started making sense in new and unexpected ways. I could see not just what someone got right or wrong, but why. That shift turned assessments from static results into living insights—evidence I could act on.
In this post, I’ll share how I use quiz data analysis to uncover those hidden stories, identify both strengths and weak spots, and use each quiz as a guide to make learning more focused and effective.
Why Quiz Scores Alone Don’t Reveal Learning Gaps
A single score rarely tells the whole story. A student might earn an overall grade of 85%, yet still miss critical concepts that impact their long-term understanding. The number looks fine, but the insights behind it often stay hidden.
1. Grades Flatten the Details
Traditional grading compresses everything—topics, question types, and skill levels—into one number. That simplicity hides valuable patterns:
- Topics where most learners struggle
- Question formats that consistently confuse
- Skills that appear strong but lack depth
Two students with the same score can have completely different learning profiles, but a traditional report won’t show the difference.
2. Manual Analysis Wastes Time
Reviewing dozens of quizzes manually to uncover those patterns is inefficient.
- Valuable data ends up buried in spreadsheets
- Instructors spend hours analyzing instead of teaching
Without automated insights, it’s nearly impossible to track performance trends across multiple learners or subjects.
3. Not Every Low Score Means a Weak Concept
Performance can drop for reasons unrelated to knowledge:
- Test anxiety or pacing issues
- Poorly phrased or ambiguous questions
- Rushing to finish within strict time limits
Analyzing time spent per question often exposes these factors. A student who answers too quickly may need pacing support, rather than a full reteach.
4. Scores Don’t Explain the ‘Why’
A grade reflects accuracy, not understanding. Without context, it can’t guide the next teaching step.
This is where quiz analytics and reporting make the difference—by breaking results into clear, actionable insights about what was understood, what wasn’t, and why.
What to Track: Key Quiz Analytics That Matter
Once you move beyond overall scores, the real value lies in the details. Certain metrics within quiz analytics can turn a basic assessment into a source of meaningful insight. Tracking these consistently helps reveal patterns that improve both instruction and learner performance.
1. Performance by Topic or Skill
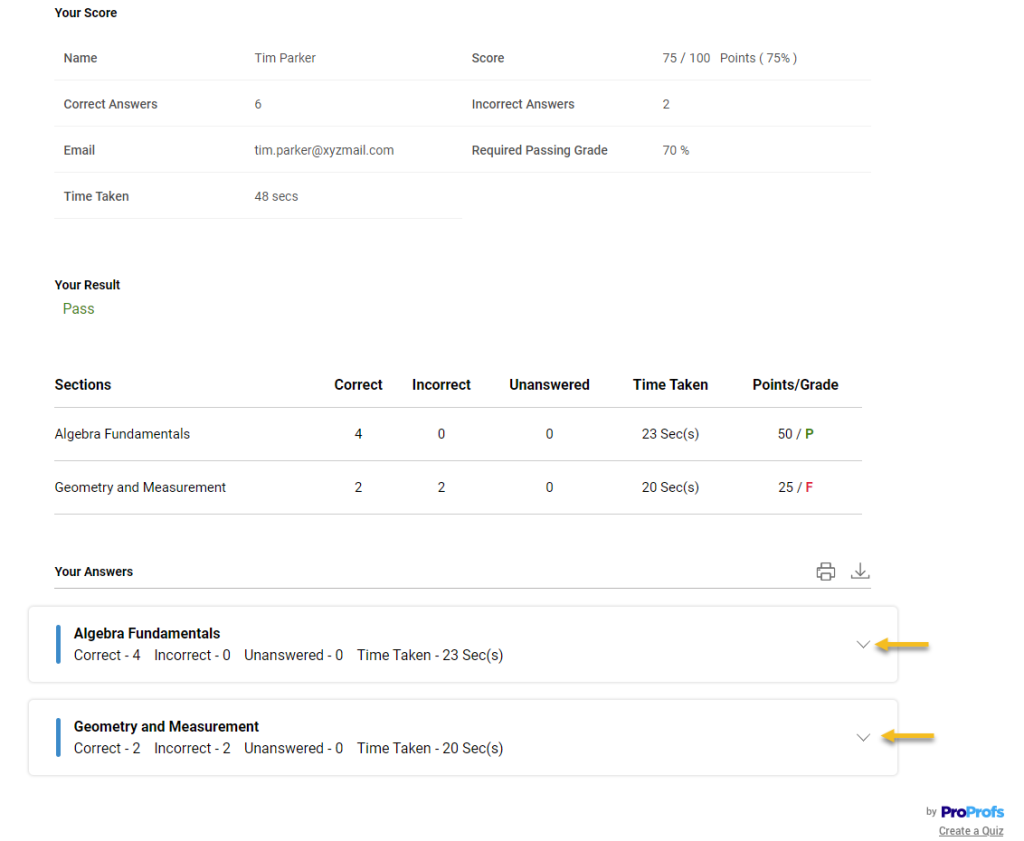
Instead of viewing results as a single total, break them down by category or learning objective. Topic-level performance reveals precisely where understanding is strong and where it falls short.
For example, a learner may excel in vocabulary but struggle with comprehension. Seeing that difference allows you to tailor follow-up activities rather than reteaching everything.
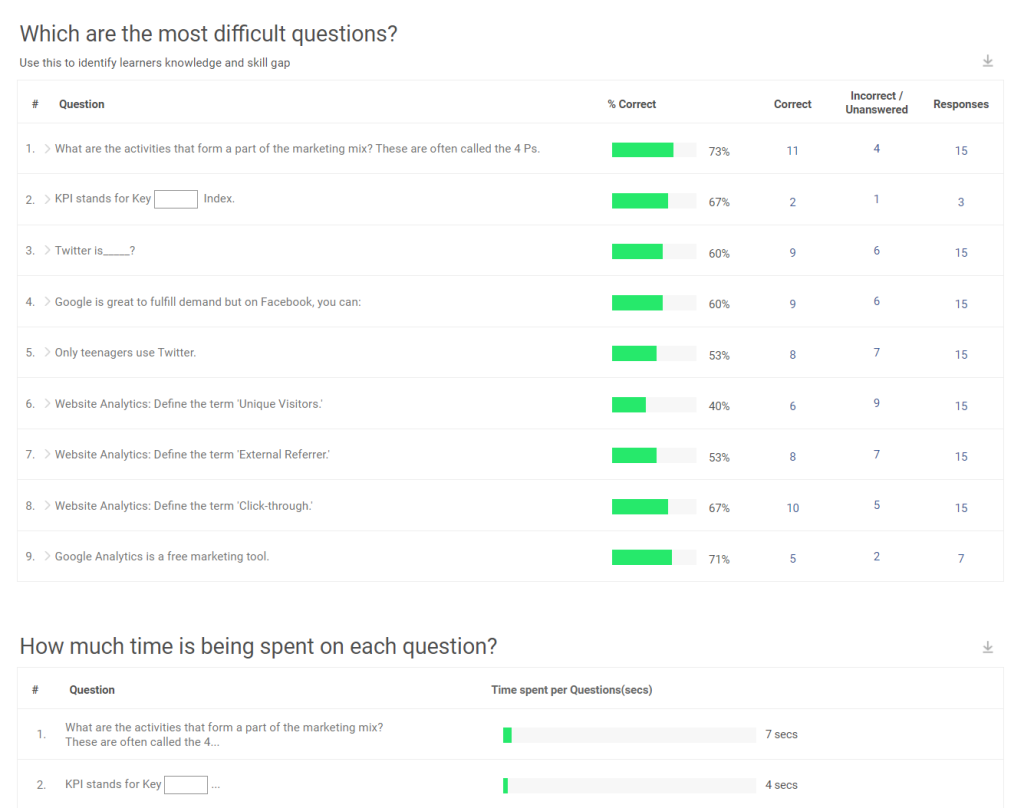
2. Question-by-Question Analysis
Individual question data highlights the areas that consistently cause confusion.
- If most learners miss the same question, it may point to a poorly phrased or overly complex item.
- If only a few struggle with it, that’s a clear indicator of a targeted skill gap.
Question-level analytics help you decide whether to revisit the topic, revise the question, or provide additional support for specific learners.
3. Time Spent per Question
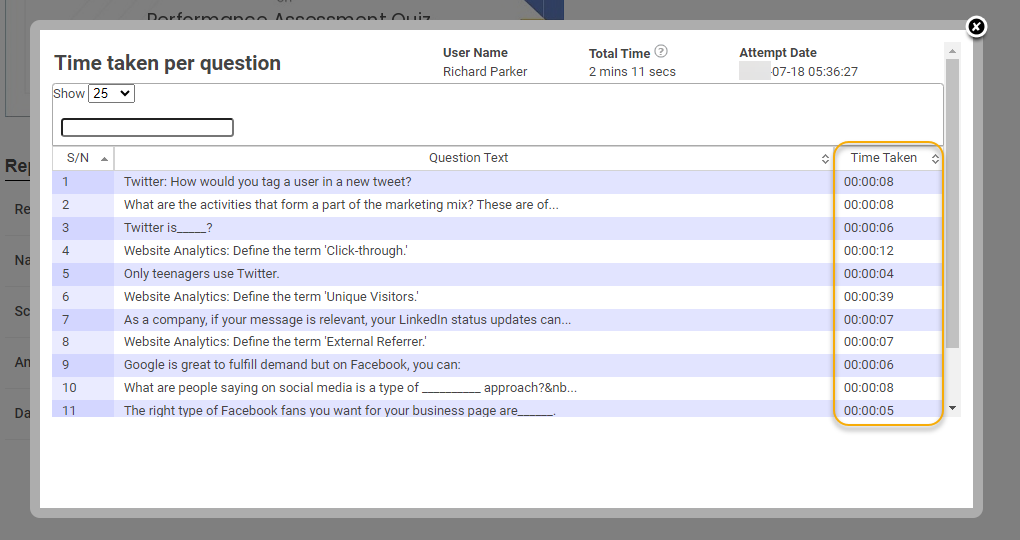
Timing data often reveals more than scores do. It shows how learners think under pressure.
- Spending too little time suggests guessing or rushing.
- Spending too much time signals uncertainty or a lack of understanding.
Patterns here can differentiate between conceptual confusion and test-taking issues, allowing for more precise feedback.
4. Progress Over Time
Tracking performance across multiple quizzes or sessions exposes growth trends.
Consistent improvement signals effective learning strategies, while plateaus or regressions highlight where to intervene. A longitudinal view turns individual assessments into a continuous learning story.
5. Completion Data and Drop-Off Points
Monitoring completion rates helps identify logistical or motivational challenges. If learners consistently skip certain sections or leave quizzes unfinished, it’s worth reviewing question flow, timing, or engagement design.
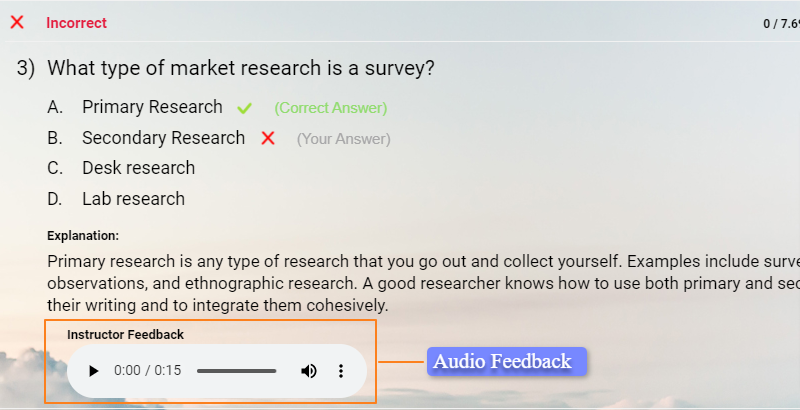
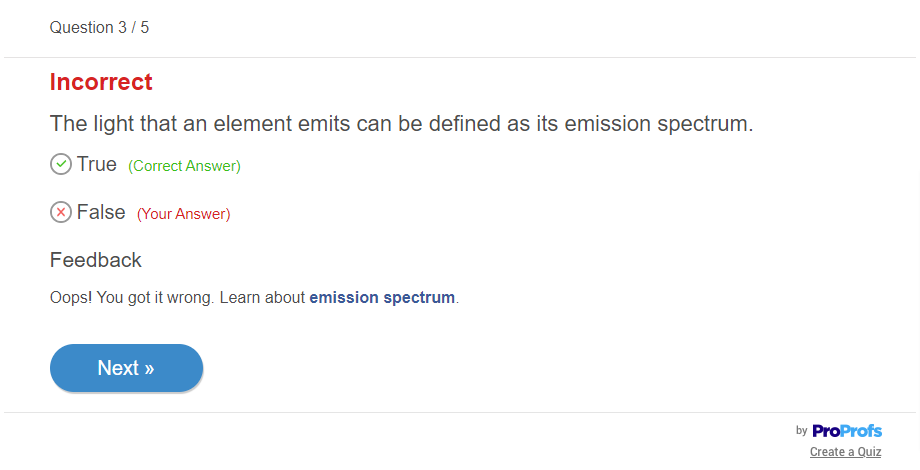
6. Feedback and Answer Reveals
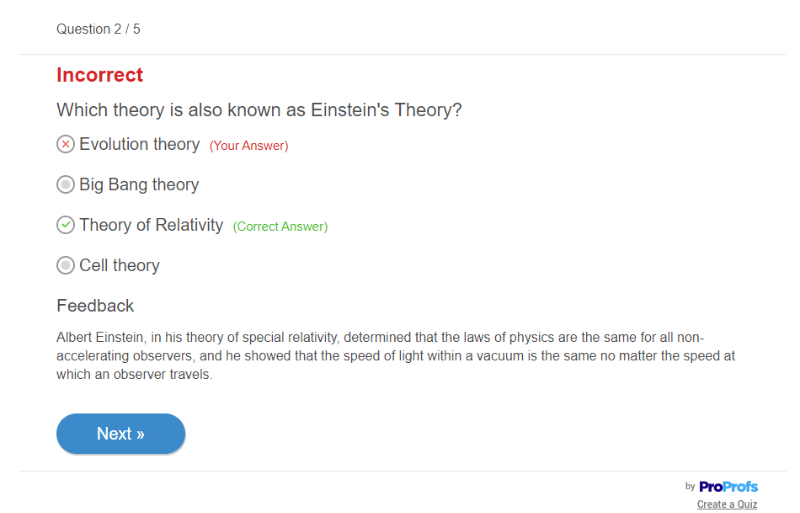
Instant feedback transforms quizzes from static evaluations into active learning tools. Allowing learners to see correct answers and explanations encourages self-correction and retention. The key is to balance transparency with assessment integrity—share feedback in formative settings, rather than on high-stakes tests.
7. Customized Result Summaries
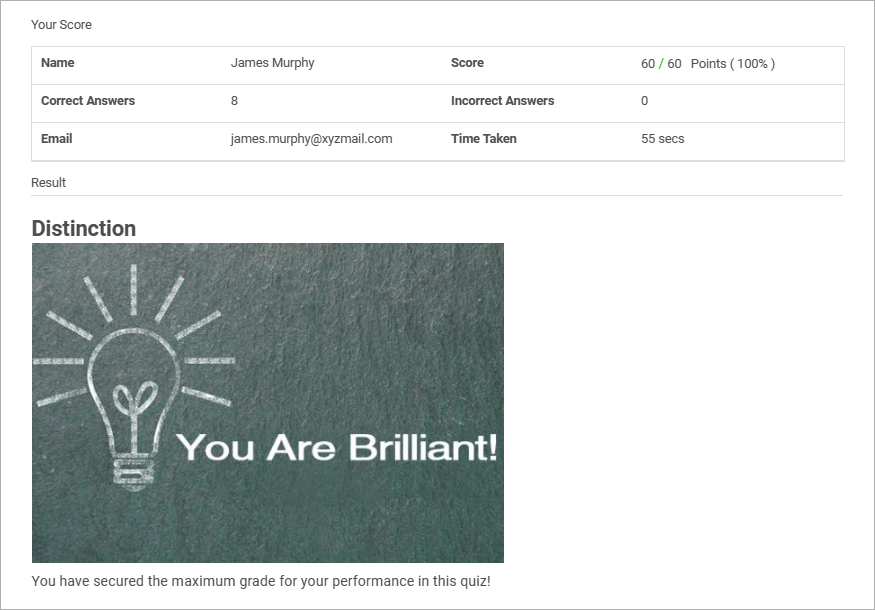
Personalized result pages add context to every score. By highlighting areas of strength, listing topics to review, or linking to relevant resources, you help learners take immediate next steps. Custom feedback turns analytics into action.
From Data to Action: How to Interpret and Respond to Quiz Results
Collecting quiz data is easy. Making sense of it is where the real work begins. The power of quiz analytics lies in interpretation — knowing how to turn data points into decisions.
When used thoughtfully, they help teachers and trainers see not just what happened in an assessment, but why it happened and what to do next.
This step transforms assessment from an event into a process — one where every result feeds back into instruction, design, and learner growth.
1. Identify the Scope of the Issue
The first step is to understand the scale of the problem. Are you dealing with a class-wide misunderstanding or a few isolated cases?
- If most learners missed the same question or topic, it often signals a gap in instruction or question clarity.
- If only a subset struggled, it suggests a localized skill gap that can be addressed with focused intervention.
Recognizing this difference prevents wasted effort — you don’t want to reteach an entire module when only five students need support.
2. Look Beyond the Score
Accuracy tells you what happened. Behavior tells you why.
Compare scores with patterns like:
- Time spent per question – Were they rushing or overthinking?
- Answer changes – Did they second-guess correct answers?
- Skipped questions – Were they uncertain or disengaged?
These small metrics often explain outcomes better than the score itself. A learner who finishes too quickly might lack focus, while one who lingers on every item might struggle with confidence. Both cases need very different solutions.
3. Use Patterns to Drive Decisions
Once you’ve identified the root cause, the next step is to link patterns to the appropriate response. Here’s a practical framework:
| Quiz Pattern | What It Indicates | Recommended Action |
|---|---|---|
| Most learners missed the same question | Concept wasn’t clearly understood | Revisit the topic in class; clarify or reword question |
| Only top scorers got it wrong | Question may be poorly phrased or misleading | Review for fairness; consider removing it from grading |
| A small group struggled in the same area | Shared gap or misconception | Plan targeted practice or a small-group session |
| One learner repeatedly underperforms in a topic | Individual learning need | Offer personalized feedback or custom assignments |
| Many skipped or left answers blank | Confusing layout or unclear instructions | Simplify interface or adjust instructions |
| Very short completion times with low accuracy | Guessing or disengagement | Reinforce pacing, engagement, or motivation strategies |
4. Translate Data Into Learner Feedback
Data only becomes useful when it leads to communication. Once patterns are identified, summarize insights in a way learners can act on:
- “Your understanding of algebraic patterns is improving, but fractions still need review.”
- “You completed the quiz too quickly—try taking more time to read each question.”
Feedback framed this way connects performance to actionable steps. It shifts the conversation from grades to growth.
5. Reassess the Assessment
Sometimes, weak results don’t reflect weak learning — they reflect a weak quiz. A flawed question, unclear instructions, or uneven distribution of difficulty can skew outcomes. Reviewing item-level performance data helps pinpoint these flaws.
If a question consistently underperforms across multiple attempts, it’s worth revisiting its wording or alignment with your objectives.
This kind of continuous refinement ensures assessments measure learning accurately — not luck or confusion.
Watch: How to Create a Quiz: Step-by-Step Tutorial
By interpreting quiz analytics through this lens, data stops being static and begins to take on a directional quality. It guides where to focus, how to adapt, and what to change next — turning each quiz into a feedback engine that fuels continuous improvement.
How to Help Learners Use Quiz Data to Improve on Their Own
The most effective use of quiz analytics doesn’t end with the instructor. When learners can read and reflect on their own performance data, they become active participants in the learning process. Instead of waiting for feedback, they begin identifying patterns, tracking progress, and adjusting their own study habits.
1. Share Insights That Build Ownership
Quiz reports shouldn’t just summarize results; they should spark reflection. Showing learners their topic-wise scores, accuracy trends, and time spent per question helps them see exactly where they’re improving and where they need to refocus.
When learners interpret their own data, they begin to view quizzes as tools for growth rather than tests of ability.
2. Encourage Reflection and Goal Setting
Turn post-quiz analysis into a short reflection exercise. Ask learners to set one or two data-backed goals, such as:
- “I’ll spend more time reviewing questions I got wrong before moving on.”
- “I’ll aim to raise my accuracy in applied questions next week.”
These small commitments lead to measurable progress and give learners a sense of control over their own improvement.
3. Keep Feedback Specific and Practical
Feedback is most effective when it’s simple and actionable. Instead of vague comments, use short, targeted statements that connect behavior to outcomes:
- “You’re confident in recall questions; now focus on reasoning-based ones.”
- “You spent the least time on Section 3, which affected accuracy — slow down next time.”
Precision in feedback helps learners see the connection between data and strategy.
4. Avoid Overloading Learners With Metrics
Too much data at once can overwhelm. Start by sharing essential information, including topic scores, correct answers, and areas for improvement. As learners become more comfortable interpreting results, gradually introduce deeper metrics, such as time analysis or trend graphs. Transparency should feel empowering, not intimidating.
5. Make It a Continuous Habit
Quiz analysis shouldn’t be limited to major tests. Regular reflection on smaller quizzes helps build consistency and momentum. When learners regularly check their own data, improvement becomes part of their routine rather than a reaction to low scores.
When learners use quiz data analysis to guide their own growth, assessments become more than one-way evaluations. They become ongoing feedback loops — where insight drives effort, and effort leads to measurable progress.
FREE. All Features. FOREVER!
Try our Forever FREE account with all premium features!
Turn Quiz Insights Into Continuous Improvement
Using quiz data effectively isn’t just about analysis — it’s about action. Once you start using quiz analytics to inform your teaching or training decisions, every quiz becomes part of a feedback system that strengthens both performance and engagement.
The key is to make this process continuous. Track results after each assessment, adjust based on what the data reveals, and repeat. Over time, these small, consistent actions compound into measurable improvement — both for learners and instructors.
Modern platforms make this process much easier. Tools like ProProfs Quiz Maker combine detailed reporting, customizable result screens, and advanced metrics such as time tracking and topic-wise analysis — all designed to help you move from scores to strategy. You can instantly identify weak areas, share personalized feedback, and even automate follow-up learning paths based on performance.
When data is used this way, assessments stop being isolated events and become engines for progress. Every quiz gives you something to refine, something to build on, and something to celebrate.

How to identify learners’ strengths and weaknesses?
Start by reviewing detailed quiz analytics. Look for consistent trends across topics or question types. High accuracy and quick responses often indicate confidence in a subject, while repeated errors or slow pacing highlight areas that need reinforcement.
How to identify your strengths and weaknesses as a student?
Students can use their own quiz reports to track patterns over time. Reviewing which topics they perform well in, which take the most time, and where they lose marks helps them target their study efforts more strategically and measure progress effectively.
What type of assessment tool is used to understand a student’s strengths and weaknesses in a particular subject area?
Digital quiz platforms with built-in analytics are most effective. They provide detailed reports by topic, question, and skill level—making it easy to spot patterns and adjust instruction or study plans accordingly.
How can quiz analytics improve both teaching and learning?
By using detailed data from quizzes, instructors can personalize instruction and focus on areas where learners need improvement, while learners gain a clearer understanding of their performance. This two-way insight turns every assessment into an opportunity for growth and continuous improvement.

Let ProProfs AI Build a Quiz
 We'd love your feedback!
What did you like & how can we make it even better?
 Thanks for your feedback!
 Ask Your Question
Have a question? Get expert help to make your decision easier.