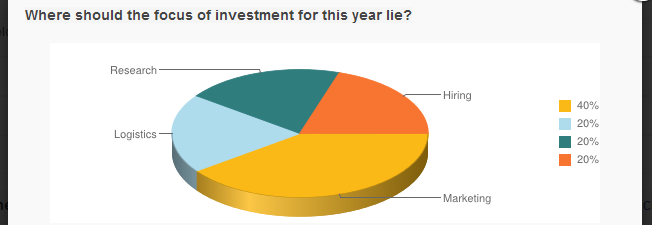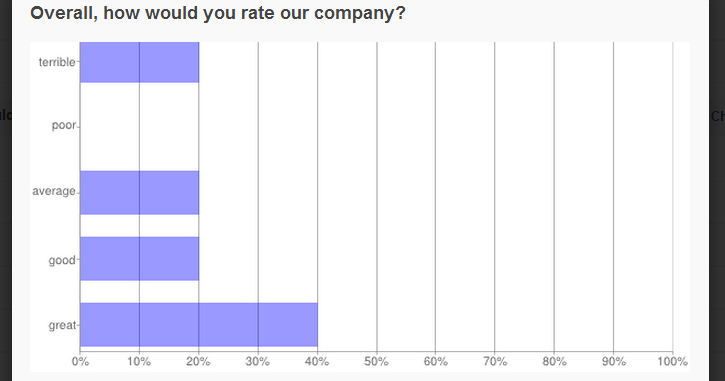
We have recently introduced new features to ProProfs Survey Maker. Now, you can download four different kinds of statistical charts for every question in a particular survey you create using our survey software.
The downloadable formats include pie charts, line charts, bar charts as well as excel spreadsheets. Since, the statistics are neatly represented in different kinds of charts, it helps you to accurately understand and analyze the results of your survey.
Different kinds of statistical charts
Pie Chart: Like its name suggests, a pie chart represents facts and figures in the form of a pie. It’s is visually appealing and is suitable for representing data such as corporate budgets.
- Pie charts are visually appealing, look professional and go well with corporate presentations.
- Pie charts represent data in a clear & simple way making it easy for anyone to interpret and understand the figures.

Line Chart: A line chart shows you change over time. It allows you to represent as well as compare different kinds of information such as multiple periods of time.
- Line charts are the best way to represent trends over a long period of time.
- Line charts allow you to compare large sets of data.

Bar Chart: A bar chart also known as a column chart represents each value in the form of a bar. It’s an excellent way to show frequency or preference, for example a rating survey for your company.
- Bar charts are simpler than line charts and make for easy representation of data.
- Bar charts are an excellent way to represent frequency for each separate value.

Excel Spreadsheet: One of the most popular spreadsheet applications out there, Microsoft Excel allows you to organize and compare massive data in a simple and effective manner.
- MS Excel has powerful analytical tools which help you to easily compare massive data.
- You can easily share and collaborate on MS Excel.

How to download survey stats?
Step 1. Go to My Surveys and click on “Stats”.

Step 2. Click on “Download” to download the statistics as an excel spreadsheet.

Step 3. Click on “Chart”.

Step 4. Select then desired chart type and click on “Download Chart”.


