
Managing a myriad of projects always takes a heavy toll on business owners because there are many problems that can halt the workflow. That’s the main reason why businesses always prefer to get experienced and certified project managers on board.
According to a recent study, 47% of projects, end up in failure due to poor management of requirements.
By and large, business owners don’t know there are many data visualization tools in the market, which can help to analyze the progress of each project precisely. Today, we will talk about the top 10 project management chart types that every business owner should be aware of, so stay away from distractions while reading the below-mentioned details:
1. Gantt Chart
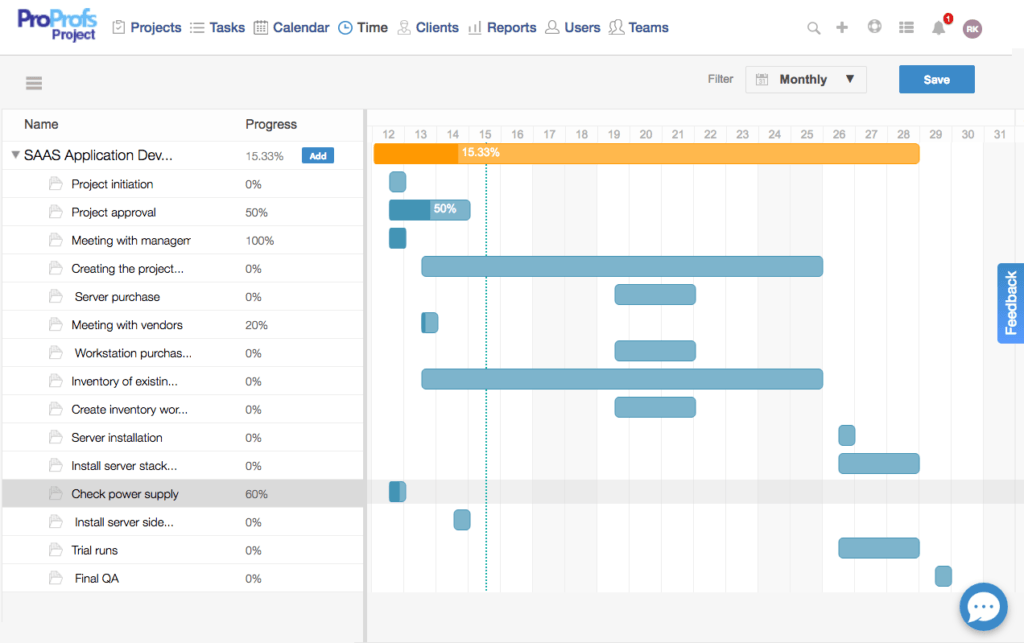
Gantt chart demonstrates the most reliable project management diagrams. It shows all the pivotal stages in projects and determines the task duration in terms of days, weeks, and months.
With the help of this project tracking chart, project managers can improve their planning, work out on potential risks, bifurcate the work for seamless handling, and so forth. Simply put, it aids in improving overall delivery time, and this could be the main reason why it always earns a spot in the list of best project management charts.
You can find the functionality of Gantt charts in most of the preeminent project management tools like ProProfs Project.
Watch this quick video to learn how ProProfs Project can simplify project management for you.
Read More: 14 Best Gantt Chart Tools to Grow Your Business
2. Flowchart
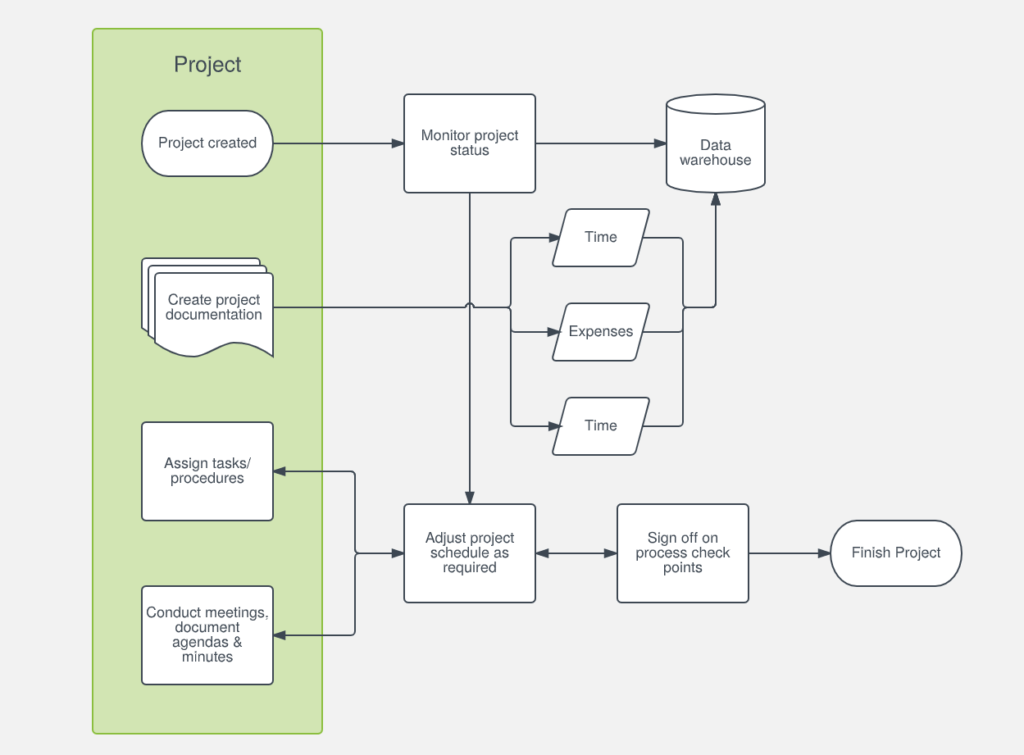
Improving efficiency levels has always been an area of concern for project managers. Flowchart, a project management chart, can help to take care of efficiency-related woes.
It sheds light on the objectives of projects and activities that are crucial for the attainment of improved efficiency levels. Basically, it paves the way for seamless communication required to ensure flawless project planning and monitoring.
It is suitable for small projects, while you have to use Gantt chart in combination to take care of complex projects.
Read More: How to Make a Gantt Chart: Step-by-Step Guide for Beginners
3. PERT Chart
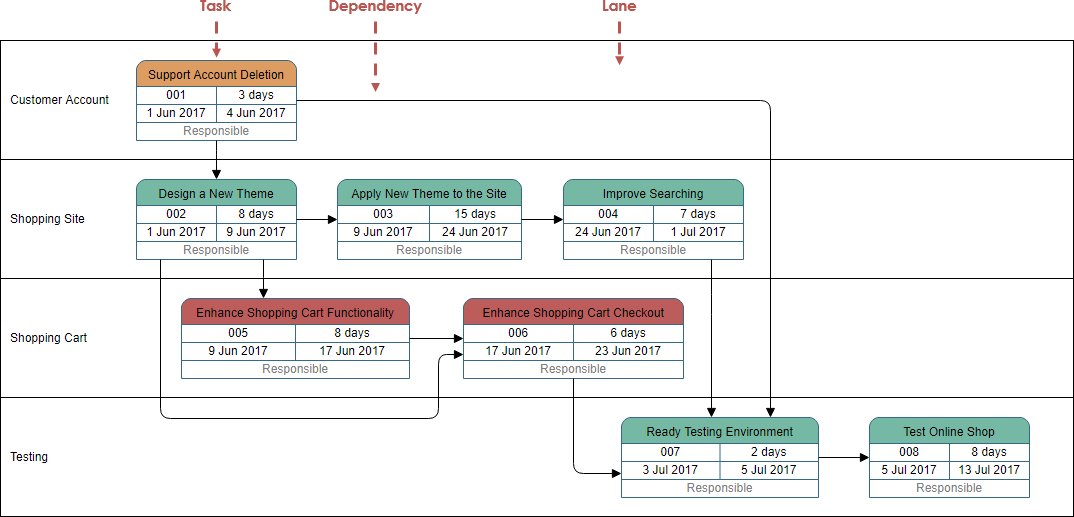
PERT is a short form of Program Evaluation Review Technique. This project chart was designed in the1950s by the US Navy. This tool comes into use when the initial planning phase of the project is over.
After proper project planning, all modules in the project are segregated into tasks so that teams across different departments can do the assigned work without experiencing any burden.
Besides, project managers enjoy increased project visibility by virtue of this process management chart, as it gives a better understanding of how much time both critical and non-critical tasks would possibly take. Coupled with efficient time management strategies, the PERT chart ensures that best practices are incorporated into everyday workflow, leading to enhanced project performance and successful project implementation.
4. Pareto Chart
Can you tell why businesses use project management charts?
Still thinking? Well, the answer is to gain knowledge to improve the odds of project success. However, project managers don’t get much information via common project slides. This is where the Pareto chart comes to rescue.
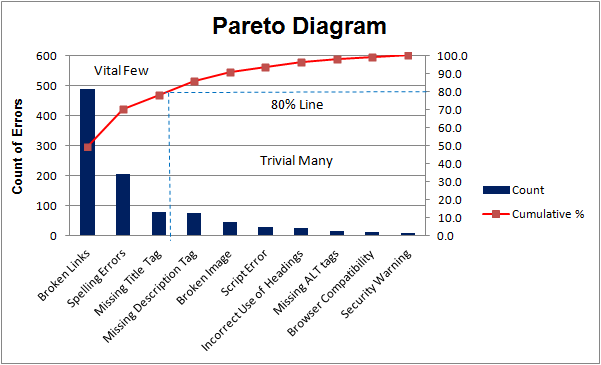
It is an amalgamation of bar and line graphs, which significantly makes the job of project management easier. Its project management diagrams aid in improving team communication and are used primarily in Six Sigma evaluation.
Read More: Agile Software Development Life Cycle (Ultimate Guide 2022)
5. Cause & Effect Chart
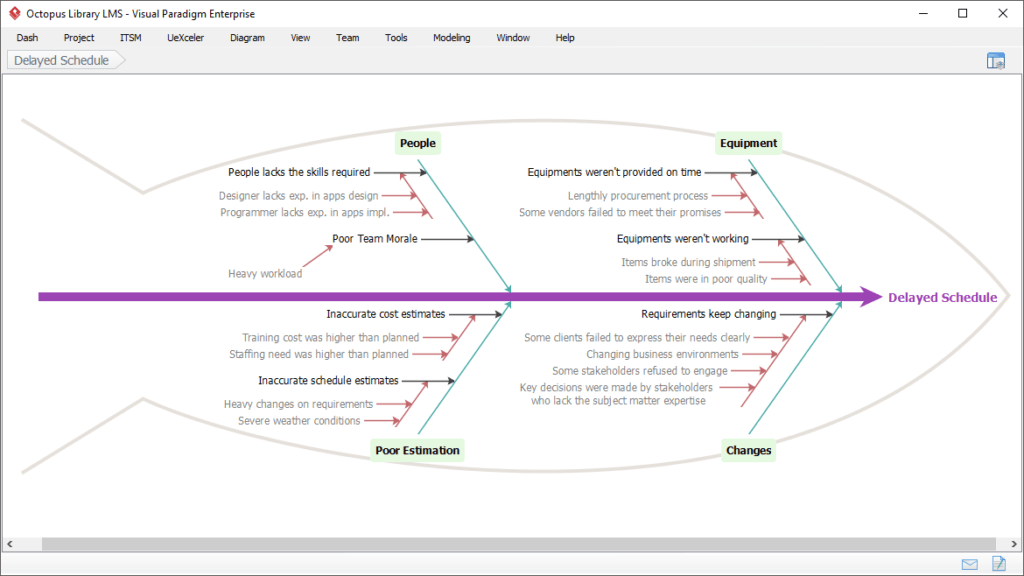
Cause & Effect chart, aka Fishbone Diagram, is used to rectify potential risks that could possibly result in project failure.
With the help of its project chart, categorizing potential problems gets easier. Needless to say, this factor increases the chances of spotting the root cause of problems. As a repercussion, you take care of all glitches once and for all.
So, if you want to use project management charts to uplift the success rate, you can give this one a try.
6. Control Chart
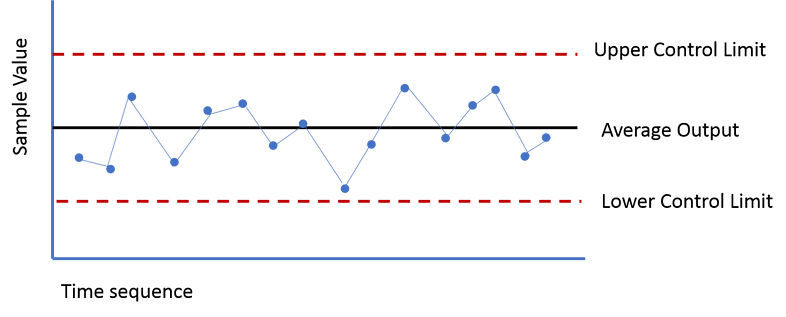
Control chart is also known as Statistical Process Control Chart. It significantly helps in project management, as it accurately shows new changes made to projects. Consequently, this helps stakeholders to develop reliable strategies to improve business growth.
The project management graphs of Control Chart cannot be taken lightly because they play a pivotal role in identifying and correcting hidden problems in projects. It goes without saying, this enhances project stability that further leads to success.
It also lends a hand while monitoring the Cost Performance Index (CPI) and Schedule Performance Index (SPI).
7. Matrix Diagram
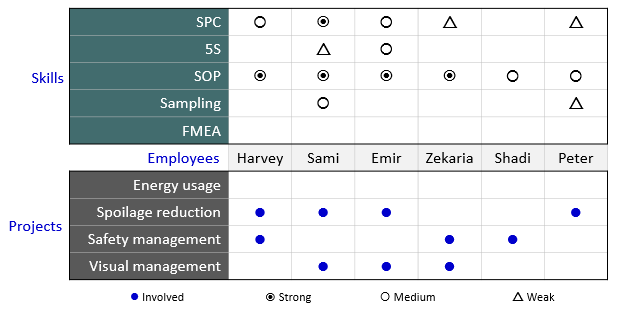
Matrix diagram is one of the vital project management charts, and that’s why it is important for those business owners who seek a long-lasting relationship with their clients.
With the help of its project management diagrams, you can easily do all tasks with respect to quality management. It shows the sequence of steps taken in a particular task, workflow, or process.
It demonstrates the association between four groups of information. With the help of the matrix diagram, you can easily know about the involvement of each team. In addition, you get a clear idea of deliverables with an RACI matrix during the project lifecycle.
8. SWOT Analysis
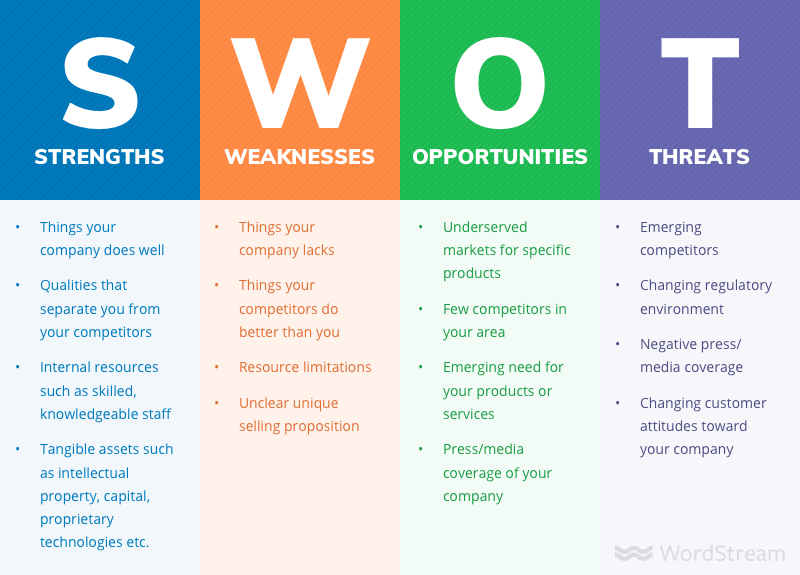
SWOT is a blend of four words: ‘Strength,’ ‘Weakness,’ ‘Opportunities’ and ‘Threat.’ It is considered as one of the best project management charts for stakeholders, as it gives insights into the strength and potential risks of the project when it’s in the planning stage.
Thanks to this project tracking chart, project managers can make the necessary decisions to improve the success rate. What’s more, SWOT analysis shows a clear picture of what business rivals are doing precisely to ensure project success and also gives an insight into the areas in your strategies where improvement is due.
In simple words, SWOT analysis shows a project management diagram, which further helps to attain high-efficiency levels.
9. Work Breakdown Structure
Work Breakdown Structure (WBS) is self-explanatory. It means dividing and assigning tasks to teams for a smooth workflow. It lets you manage work in such a manner that ensures the deliverables of projects don’t get hampered.
It ensures all teams work in accordance with project requirements. Through WBS, stakeholders are likely to come up with an appropriate project plan.
Needless to mention, when you have a clear plan, the chances of project completion are likely to be on the cards. It will improve business growth, consequently.
10. Timeline Schedule
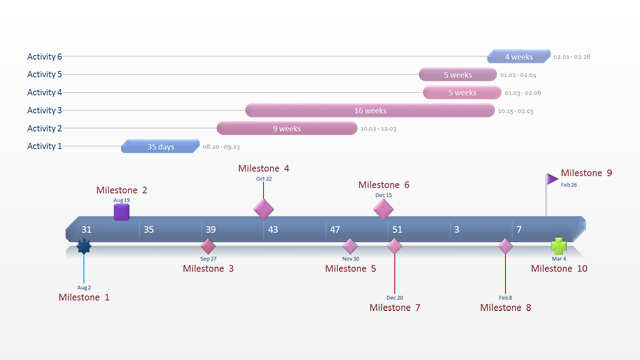
Last but not least, a timeline schedule is one of those project management charts that can help you strengthen your position in the business world, because it aids in achieving what all enterprises strive for: ‘A proper time management’.
In simple words, it helps you monitor time each team is taking on assigned projects. Owing to this, you can identify those factors that are slowing down the workflow. Once you rectify potential delays, you are likely to get expected deliverables on time, which is going to delight you, isn’t it?
Conclusion:
To keep your business evolving, it is imperative to complete all projects on time and within the set budget. During the project lifecycle, some specific and some uncertain complications occur. These must be addressed aptly as that makes the difference between success and failure.
By means of this write-up, we have discussed the top 10 project management chart types so that you can get an idea of what you need to use to ensure success.
In case you want to share some suggestions with us, leave a comment below.
Frequently Asked Questions
Q. Which type of chart is used primarily for project management?
- A Gantt chart is primarily used for project management. Project managers use it frequently for effective project handling. A Gantt Chart enables the following:
- Easier task scheduling.
- Convenient time tracking via clear and visual representation of project progress.
- Accurate execution of project plans by adding task dependencies.
Q. What should be included in a Gantt chart?
- Although the Gantt chart is best among its own kind, but it would be great if things like a dependent task, critical path, color coding, etc. are included. Plus, the bars should indicate the amount of work, which is not possible as of now.
Q. What is the difference between a Gantt chart and a PERT chart?
- The main difference between these charts is Gantt charts are basically a bar chart, while the PERT one is a flow chart. Although both these charts make the task of project management easier, but the factor that makes PERT chart less preferable is that it can be very confusing and complex at times, while this isn’t the case with the Gantt chart.
Do you want a free Project Management Software?
We have the #1 Online Project Management Software for effective project management.

