Population Growth Quiz Exam!


(216).jpg "Population Growth Quiz Exam! - Quiz")
.
- 1.

The graph below shows the changes in the size of a fish population over a period of time. The dashed line on the graph represents the
- A.
Carrying capacity of the environment
- B.
Life span of the species
- C.
Level at which extinction is reached
- D.
Level of maximum biodiversity of the species
Correct Answer
A. Carrying capacity of the environmentExplanation
The dashed line on the graph represents the carrying capacity of the environment. Carrying capacity refers to the maximum number of individuals of a species that an ecosystem can sustainably support. In this context, it represents the maximum population size that the fish population can reach without depleting their resources or causing environmental degradation. The graph shows that the fish population fluctuates around the carrying capacity line, indicating that the population size is regulated by the availability of resources in the environment.Rate this question:
-
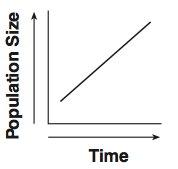
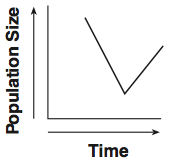
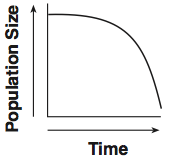
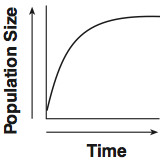
- 2.
Which graph represents a population that grew and is maintained at the carrying capacity of its ecosystem?
- A.
![Population Growth Quiz Exam! - Quiz]()
- B.
![Population Growth Quiz Exam! - Quiz]()
- C.
![Population Growth Quiz Exam! - Quiz]()
- D.
![Population Growth Quiz Exam! - Quiz]()
Correct Answer
D.Explanation
The correct answer to this question would be a graph that shows a population initially growing rapidly, reaching a peak, and then leveling off and maintaining a stable population size. This indicates that the population has reached the carrying capacity of its ecosystem, where the available resources can support the population without further growth. This graph would typically show an S-shaped curve, known as the logistic growth curve, which represents the population growth pattern in a limited environment.Rate this question:
-
- 3.
The dotted line on the graph below represents the potential size of a population-based on its reproductive capacity. The solid line on this graph represents the actual size of the population. Which statement best explains why the actual population growth is less than the potential population growth?
- A.
Resources in the environment are limited.
- B.
More organisms migrated into the population than out of the population.
- C.
The birthrate gradually became greater than the death rate.
- D.
The final population size is greater than the carrying capacity.
Correct Answer
A. Resources in the environment are limited.Explanation
The correct answer is "Resources in the environment are limited." This statement best explains why the actual population growth is less than the potential population growth. Limited resources in the environment, such as food, water, and space, can restrict the population's ability to grow to its full potential. As the population size increases, competition for these limited resources intensifies, leading to a decrease in population growth.Rate this question:
-
- 4.
Changes in a deer population are shown in the graph below. Which statement best explains section X?
- A.
The population has reached the carrying capacity of its environment.
- B.
Energy is used for interbreeding between members of different species.
- C.
A predator recycles the remains of dead organisms.
- D.
Competition does not occur between members of different species in the same habitat.
Correct Answer
A. The population has reached the carrying capacity of its environment.Explanation
Section X on the graph shows a plateau where the population remains relatively stable over time. This indicates that the population has reached its carrying capacity, which is the maximum number of individuals that the environment can support. At carrying capacity, the birth rate is equal to the death rate, resulting in a stable population size.Rate this question:
-
- 5.
Students conducting a study on an insect population placed 25 insects of the same size in a box. The amount of food, water, and shelter available to the insects was kept constant. Each month, students removed and counted the number of insects present, recorded the total, and returned the insects to the box. The graph below shows the number of insects in the box over a 12- month period. What inference can be made regarding this insect population?
- A.
All the insects in the box are the same age.
- B.
The insects hibernated from January to April.
- C.
The population has carnivorous members.
- D.
The population reached carrying capacity by January.
Correct Answer
D. The population reached carrying capacity by January.Explanation
The graph shows that the number of insects in the box increases steadily from January to April, and then remains relatively constant for the rest of the year. This indicates that the population has reached its carrying capacity, which is the maximum number of individuals that the environment can support.Rate this question:
-
- 6.
The size of a mouse population in a natural ecosystem tends to remain relatively constant due to:
- A.
The carrying capacity of the environment
- B.
The lack of natural predators
- C.
Cycling of energy
- D.
Increased numbers of decomposers
Correct Answer
A. The carrying capacity of the environmentExplanation
The size of a mouse population in a natural ecosystem tends to remain relatively constant due to the carrying capacity of the environment. Carrying capacity refers to the maximum number of individuals that an ecosystem can support sustainably. When the mouse population reaches its carrying capacity, there is limited availability of resources such as food, water, and shelter, which prevents further population growth. This balance between population size and available resources helps maintain a relatively constant population size over time.Rate this question:
-
- 7.
The carrying capacity for herbivores in a habitat is most directly affected by the availability of:
- A.
Heat energy released by carnivores
- B.
Carbon dioxide in the atmosphere
- C.
Decomposers in the soil
- D.
Autotrophs in the habitat
Correct Answer
D. Autotrophs in the habitatExplanation
The carrying capacity for herbivores in a habitat is most directly affected by the availability of autotrophs in the habitat. Autotrophs, such as plants, are the primary producers in an ecosystem and provide the energy and nutrients needed by herbivores. The population of herbivores in a habitat is limited by the amount of available autotrophs, as they are the main source of food for herbivores. If there is a decrease in the number of autotrophs, it will directly impact the carrying capacity of herbivores in the habitat, potentially leading to a decrease in their population size.Rate this question:
-
- 8.
Which of the following is not an example of a limiting resource for a plant?
- A.
The color of the flower
- B.
The amount of water available
- C.
The amount of sunlight available
Correct Answer
A. The color of the flowerExplanation
The color of the flower is not an example of a limiting resource for a plant because it does not directly affect the plant's ability to grow, reproduce, or survive. Limiting resources are typically essential factors such as water, sunlight, nutrients, or space that can restrict a plant's growth and development. The color of the flower is determined by genetic factors and does not play a significant role in the plant's overall health or resource allocation.Rate this question:
-
- 9.
Which of the following are not characterized by environmental limits of population growth?
- A.
Food and water
- B.
Shelter
- C.
Predation
- D.
Space
- E.
Carrying Capacity
- F.
Logistic Growth Curve
Correct Answer
D. SpaceExplanation
Space is not characterized by environmental limits of population growth because it refers to the physical area or territory available for a population to inhabit. While limited space can indirectly affect population growth by influencing factors such as competition for resources and territoriality, it is not an environmental limit in itself. Environmental limits typically refer to factors such as food and water availability, shelter, predation, and carrying capacity, which directly impact the ability of a population to grow and thrive in a given environment. The logistic growth curve is a mathematical model that represents the population growth rate as it approaches and reaches its carrying capacity, which is determined by environmental factors.Rate this question:
-
- 10.
A population will continue to grow if births + immigrants is ________________ deaths + emigration.
- A.
Less than
- B.
More than
- C.
Equal to
Correct Answer
B. More thanExplanation
If the number of births and immigrants is greater than the number of deaths and emigration, then the population will continue to grow. This is because the influx of new individuals through births and immigration exceeds the number of individuals leaving the population through deaths and emigration.Rate this question:
-


Quiz Review Timeline +
Our quizzes are rigorously reviewed, monitored and continuously updated by our expert board to maintain accuracy, relevance, and timeliness.
-
Current Version
-
Mar 22, 2023Quiz Edited by
ProProfs Editorial Team -
Sep 30, 2019Quiz Created by
Dharary75
 Back to top