Technical Analysis

This is your description.
- 1.
A green candlestick signifies which of the following?
- A.
Close higher than the Open
- B.
Open higher than the Close
- C.
Close at the Open
- D.
None of the Above
Correct Answer
A. Close higher than the OpenExplanation
A green candlestick signifies a positive day in the markets.Rate this question:
-
- 2.
Reversal Candlesticks have?
- A.
Large wicks, small bodies
- B.
Small wicks, large bodies
- C.
Large wicks, large bodies
- D.
Small wicks, small bodies
Correct Answer
A. Large wicks, small bodiesExplanation
A large wick signifies that a market reached a certain level that it was not able to close at.Rate this question:
-
- 3.
Characteristic(s) of a marabozu candletstick is(are) ?
- A.
Full candlestick
- B.
Signifies strong uptrend or downtrend
- C.
Little to no wick
- D.
All of the Above
Correct Answer
D. All of the AboveExplanation
Marabozu candlesticks are a good sign of a strong uptrend or downtrendRate this question:
-
- 4.
A Doji shows?
- A.
Uptrend
- B.
Downtrend
- C.
Indecision
- D.
Market Close
Correct Answer
C. IndecisionExplanation
A doji occurs when the market open is near the market close. Shows indecision in the markets.Rate this question:
-
- 5.
Tweezer Bottoms indicates?
- A.
Bullish Rally
- B.
Reversal
- C.
Bearish Rally
- D.
Both a & b
Correct Answer
D. Both a & bExplanation
Tweezer bottoms indicate the bottom of the marketRate this question:
-
- 6.
An evening star indicates?
- A.
End of an uptrend
- B.
End of a downtrend
- C.
Indecision
- D.
Market Close
Correct Answer
A. End of an uptrendExplanation
The bulls have burned out!Rate this question:
-
- 7.
A symmetrical candle indicates ?
- A.
Bullish market
- B.
Bearish market
- C.
Indecision
- D.
None of the Above
Correct Answer
C. IndecisionExplanation
Buyers and sellers are fighting in the formation of a symmetrical triangle.Rate this question:
-
- 8.
Which of the following in an example of dynamic support and resistance?
- A.
Bollinger Bands
- B.
RSI
- C.
MACD
- D.
None of the Above
Correct Answer
A. Bollinger BandsExplanation
Bollinger Bands are uses to show price action within a certain standard deviation of priceRate this question:
-
- 9.
Breakout occur when price breaks which of the following?
- A.
Support
- B.
Resistance
- C.
Open
- D.
Both a & b
Correct Answer
D. Both a & bExplanation
Breakout occurs when the price of an asset breaks through a significant level of support or resistance. Support is a level where the price tends to find buying pressure and bounces back up, while resistance is a level where the price tends to find selling pressure and reverses its upward movement. When the price breaks through either support or resistance, it indicates a shift in market sentiment and often leads to a significant move in the direction of the breakout. Therefore, the correct answer is "Both a & b" because breakout can occur when the price breaks either support or resistance levels.Rate this question:
-
- 10.
An acceptable risk to reward ratio is ?
- A.
4:1
- B.
3:1
- C.
2:1
- D.
1:2
Correct Answer
D. 1:2Explanation
You want the odds in your favor!Rate this question:
-
- 11.
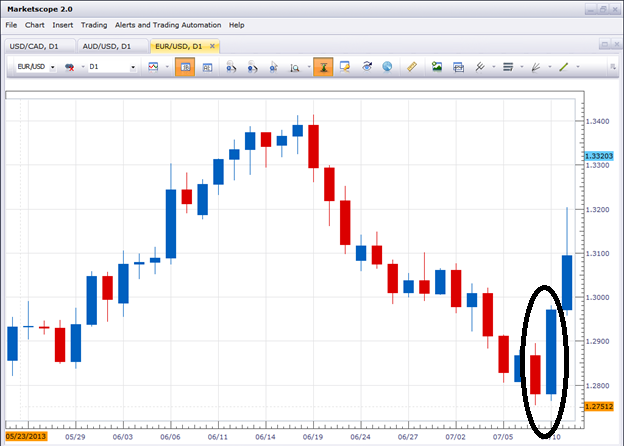
The following image shows the formation of?
- A.
Bearish Engulfing
- B.
Bullish Engulfing
- C.
Morning Star
- D.
Evening Star
Correct Answer
B. Bullish EngulfingExplanation
The given image shows a bullish engulfing pattern. This pattern occurs when a small bearish candle is followed by a larger bullish candle that completely engulfs the previous candle's body. It indicates a reversal of the previous downtrend and suggests that buyers have taken control of the market.Rate this question:
-
- 12.
The following image shows?
- A.
Breakout
- B.
Open
- C.
Close
- D.
None of the Above
Correct Answer
A. BreakoutExplanation
The given image shows a breakout, which is a technical analysis pattern in which the price of an asset breaks through a resistance level or a support level. A breakout is considered significant as it indicates a potential change in the direction of the price trend. In this case, since the image does not show any other relevant information or options, we can conclude that the correct answer is breakout.Rate this question:
-
- 13.
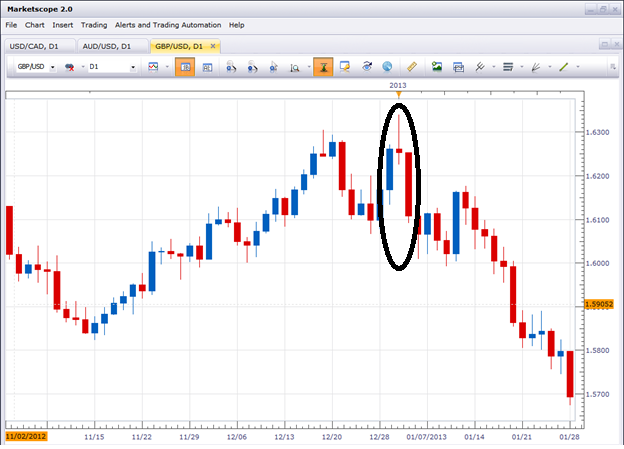
The following image shows?
- A.
Morning Star
- B.
Evening Star
- C.
Three White Soldiers
- D.
Three Black Crows
Correct Answer
B. Evening StarExplanation
Indication that prices will move lower.Rate this question:
-
- 14.
The following image shows?
- A.
Market has found a floor at 79.00
- B.
Bearish market
- C.
Market will not go higher than 84.00
- D.
None of the Above
Correct Answer
A. Market has found a floor at 79.00Explanation
Market failed to close below 79.00. Formed an extremely long wick.Rate this question:
-
- 15.
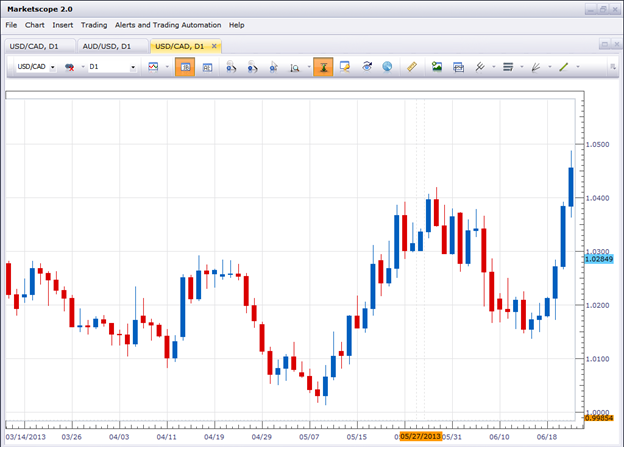
The following image shows?
- A.
A break through of the 1.04 level
- B.
An uptrend
- C.
Three White Soldiers
- D.
All of the Above
Correct Answer
D. All of the AboveExplanation
This is a strong bullish signal. The market looks like it will go higher until it finds a new resistance level.Rate this question:
-
Quiz Review Timeline +
Our quizzes are rigorously reviewed, monitored and continuously updated by our expert board to maintain accuracy, relevance, and timeliness.
-
Current Version
-
Mar 20, 2023Quiz Edited by
ProProfs Editorial Team -
Jul 31, 2013Quiz Created by
Fxctrade
- Aeronautics Quizzes
- Aerospace Quizzes
- Agricultural Science Quizzes
- Astrology Quizzes
- Astronomy Quizzes
- Atom Quizzes
- Biochemistry Quizzes
- Biology Quizzes
- Biomechanics Quizzes
- Biostatistics Quizzes
- Biotechnology Quizzes
- Botany Quizzes
- Branches Of Science Quizzes
- Chemistry Quizzes
- Cytology Quizzes
- Easy Science Quizzes
- Ecology Quizzes
- Electrical Quizzes
- Embryology Quizzes
- Endocrinology Quizzes
- Engineering Quizzes
- Environmental Science Quizzes
- Epidemiology Quizzes
- Forestry Quizzes
- Fossil Quizzes
- Gas Quizzes
- General Science Quizzes
- Genetics Quizzes
- Histology Quizzes
- Human Biology Quizzes
- Integrated Science Quizzes
- Invention Quizzes
- Library Science Quizzes
- Lighting Quizzes
- Liquid Quizzes
- Marine Biology Quizzes
- Microbiology Quizzes
- Molecular Biology Quizzes
- Nature Quizzes
- Neuroscience Quizzes
- Nuclear Science Quizzes
- Oceanography Quizzes
- Physics Quizzes
- Psychology Quizzes
- Science And Technology Quizzes
- Science Glossary Quizzes
- Science Knowledge Quizzes
- Science Practice Quizzes
- Scientific Notation Quizzes
- Soil Science Quizzes
- Solar System Quizzes
- Solid Quizzes
- Zoology Quizzes
 Back to top


.png)

.png)
