Candlestick Pattern Quiz Questions And Answers
(512).jpg)
Welcome to our Candlestick Pattern Quiz Questions and Answers, a specialized tool designed for traders who want to master the art of reading and interpreting candlestick charts. This quiz is perfect for both beginners and experienced traders aiming to sharpen their technical analysis skills and improve their market predictions.
Our quiz covers a wide array of candlestick patterns, from basic single-bar formations to more complex multi-bar configurations. Each question is crafted to challenge your understanding and help you recognize these patterns in real trading scenarios. With each correct answer, you'll receive detailed explanations that not only confirm the right choice Read morebut also provide insights into why other options were less suitable.
This interactive quiz is an excellent way to test your knowledge, refine your trading strategies, and gain a deeper understanding of how candlestick patterns can signal market movements. Whether you're preparing for a trading certification or simply looking to enhance your trading acumen, our Candlestick Pattern Quiz Questions and Answers will help you develop a keen eye for potentially profitable opportunities in the markets. Start your journey to becoming a candlestick expert today!
Candlestick Pattern Questions and Answers
- 1.
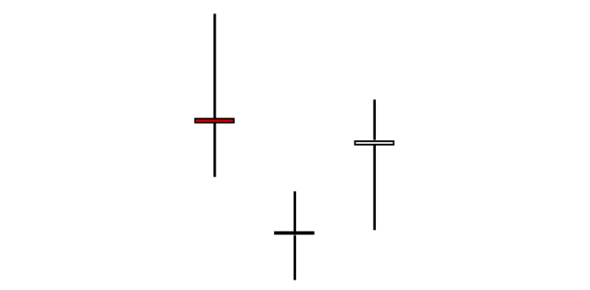
What do these types of candles represent in the market place.
- A.
Bearish Bias
- B.
Bullish Bias
- C.
Indecision
- D.
Miss print on the chart
Correct Answer
C. IndecisionExplanation
Indecision candles in trading are characterized by their small bodies and long wicks, visually representing uncertainty and a lack of control by either buyers or sellers in the marketplace. These candles are key indicators that the current market trend may be losing momentum and that a potential change in direction could be imminent. Typically, they prompt traders to adopt a cautious approach, preferring to wait for additional signals that confirm the market’s future movement before committing to any trades. The appearance of indecision candles suggests a balanced struggle where neither side has the upper hand, often leading to a period of consolidation before a clearer trend emerges.Rate this question:
-
- 2.
What is the name of this candle pattern?
- A.
Shooting Star
- B.
Evening Star
- C.
Bearish Engulfing
- D.
Morning Star
Correct Answer
D. Morning StarExplanation
The Morning Star candlestick pattern is a compelling visual indicator used by traders to identify a potential reversal from a downtrend to an uptrend. This pattern is composed of three distinct candles. The first is a long bearish candle, which illustrates strong selling pressure. Following this, there is a small candle, which can be either bullish or bearish, typically gapping down from the previous candle, signifying market indecision and a potential shift in momentum. The sequence concludes with a long bullish candle, indicating a resurgence of buying pressure, which confirms the reversal. Traders often view the formation of a Morning Star pattern as a bullish signal, suggesting that it might be an opportune time to consider entering long positions as the downtrend could be exhausting and an uptrend is on the horizon.Rate this question:
-
- 3.
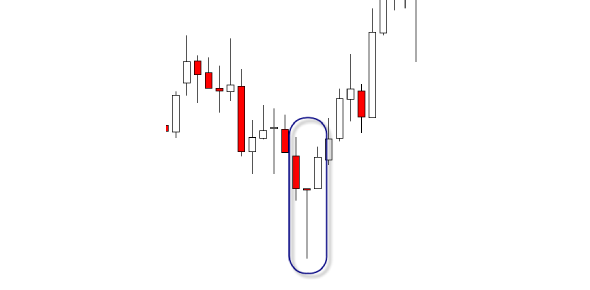
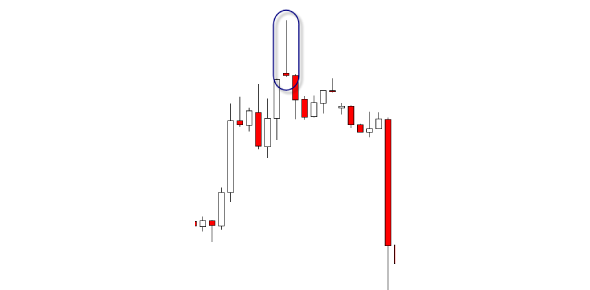
What is the name of this candle pattern?
- A.
Evening Star
- B.
Shooting Star
- C.
Morning Star
- D.
Afternoon Star
Correct Answer
B. Shooting StarExplanation
The Shooting Star candlestick pattern is an important reversal indicator in technical analysis, particularly at the end of an uptrend. This pattern is characterized by a small real body at the lower end of the trading range, with a long upper shadow that typically measures at least twice the length of the body. The formation occurs when prices open near the low, rally during the session to trade significantly higher, but close near the opening price. This indicates that while buyers initially drove prices up, significant selling pressure emerged, pushing prices back down to close around where they started. The presence of this pattern suggests that the buyers are losing control and the sellers are beginning to dominate, potentially signaling a reversal of the prevailing uptrend. Traders often see a Shooting Star as a sign to consider taking profits on bullish positions or preparing for potential short entries.Rate this question:
-
- 4.
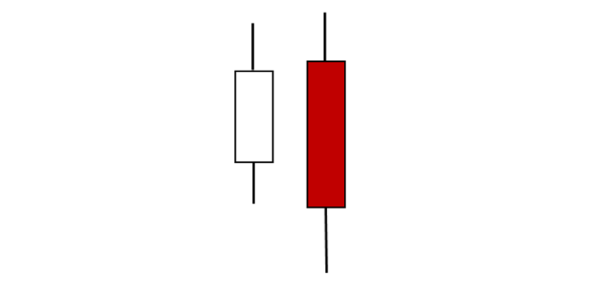
The following candle pattern is called a _______________.
- A.
Evening Star
- B.
Shooting Star
- C.
Bearish Engulfing
- D.
Inside Candle
Correct Answer
C. Bearish EngulfingExplanation
A Bearish Engulfing pattern is a strong sign that a price trend might be about to drop after rising for a while. This pattern happens when a smaller green (or bullish) candle is followed by a bigger red (or bearish) candle that completely covers the green candle. It shows that the sellers are taking over the buyers. The bigger red candle means that there's a lot of selling going on, which could lead to the price going down. When traders see this pattern, they often think it's a good time to sell or to be careful if they were thinking about buying.Rate this question:
-
- 5.
The following candle is called a _______________.
- A.
Doji Candle
- B.
Hammer Candle
- C.
Bearish Engulfing
- D.
Bullish Candle
Correct Answer
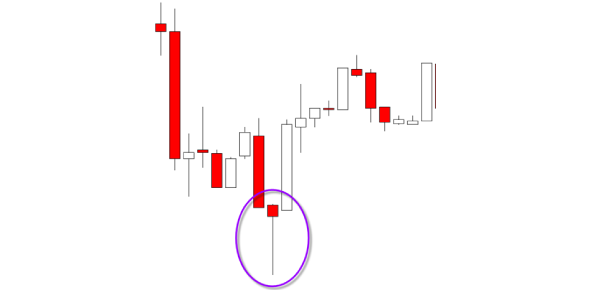
B. Hammer CandleExplanation
A hammer candle is a bullish pattern that looks like a hammer with a small body at the top and a long lower wick. It forms when prices fall but then rebound close to where they started, showing buyers are gaining control. This pattern often signals a potential switch from a downtrend to an uptrend, suggesting it might be a good time to think about buying.Rate this question:
-
- 6.
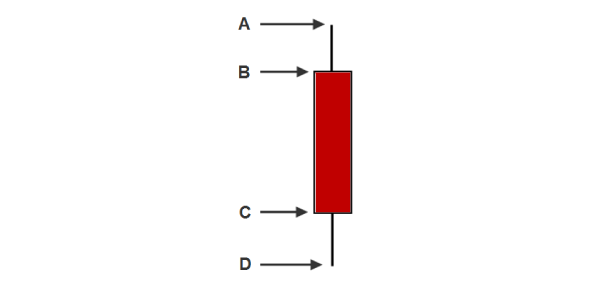
Name the correct A, B, C, and D points on this candle.
- A.
A=HIGH B=CLOSE C=OPEN D=LOW
- B.
A=HIGH B=OPEN C=CLOSE D=LOW
Correct Answer
B. A=HIGH B=OPEN C=CLOSE D=LOWExplanation
In candlestick charting, each candlestick provides information about four key prices: the high, open, close, and low of a given time period. The "high" (A) is the top price reached during the period, the "open" (B) is the price at which trading started, the "close" (C) is the price when trading ended, and the "low" (D) is the lowest price during the period. This setup helps traders understand price movements and market sentiment for that period.Rate this question:
-
- 7.
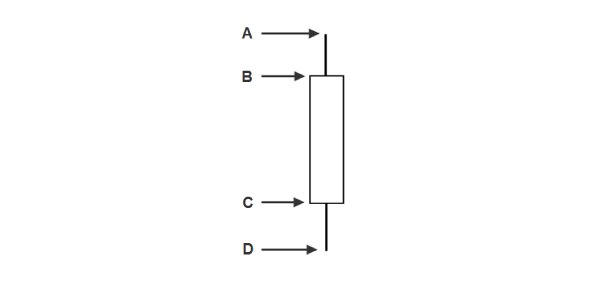
Name the correct A, B, C, and D points on this candle.
- A.
A=HIGH B=CLOSE C=OPEN D=LOW
- B.
A=HIGH B=OPEN C=CLOSE D=LOW
Correct Answer
A. A=HIGH B=CLOSE C=OPEN D=LOWExplanation
In candlestick charting, each candlestick shows the price movements within a specific time period through four key points: high, low, open, and close. The high point (A) is the highest price reached, the low point (D) is the lowest price, the open point (C) is where the price started, and the close point (B) is where the price ended. This arrangement helps traders see not only the price range but also whether the period ended higher or lower than it started.Rate this question:
-
- 8.
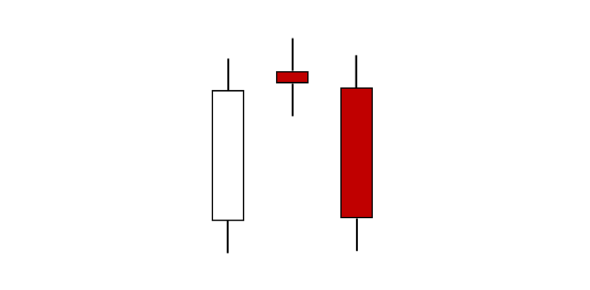
The following candle pattern is called a _______________.
- A.
Shooting Star
- B.
Morning Star
- C.
Evening Star
- D.
Hammer Star
Correct Answer
C. Evening StarExplanation
The Evening Star pattern is a bearish reversal signal in candlestick charting that consists of three key candlesticks. The first is a large bullish candle, indicating strong buying pressure. This is followed by a small-bodied candle that typically gaps above the first one, showing hesitation and reduced momentum. The third candlestick is a large bearish one that closes below the midpoint of the first candle. This sequence suggests that after a period of buying, sellers are taking control, potentially leading to a reversal from an upward to a downward trend. It's a signal that could suggest it's time to consider selling or holding off on buying.Rate this question:
-
- 9.
Select 2 bearish candle patterns.
- A.
Hammer Candle
- B.
Shooting Star
- C.
Evening Star
- D.
Morning Star
Correct Answer(s)
B. Shooting Star
C. Evening StarExplanation
The Shooting Star and Evening Star are both bearish candlestick patterns indicating potential trend reversals in an uptrend. The Shooting Star shows a price spike that fails, closing near its open after sellers push it down, suggesting a shift in momentum. The Evening Star, involving three candles, starts with strong buying, followed by a candle showing indecision, and concludes with a large bearish candle that closes below the midpoint of the first, confirming a switch from bullish to bearish momentum. These patterns help traders recognize when to potentially sell or exit long positions as an uptrend may be ending.Rate this question:
-
- 10.
Bearish reversal patterns are most probable when they occur at ________________.
- A.
Resistance Levels
- B.
Support Levels
- C.
Any Level
Correct Answer
A. Resistance LevelsExplanation
Bearish reversal patterns are most probable when they occur at resistance levels. This is because resistance levels represent a price level where selling pressure is strong and can potentially overpower buying pressure, causing a reversal in the upward trend. When a bearish reversal pattern forms at a resistance level, it indicates that the selling pressure has increased and the price is likely to decline. Therefore, resistance levels are significant in identifying potential bearish reversals in the market.Rate this question:
-
- 11.
Check all that apply. Name 4 types of bullish candlestick patterns.
- A.
Morning star
- B.
Evening Star Reversal
- C.
Inverse hammer
- D.
Shooting Star
- E.
Three white soldiers
- F.
Horse Shoe Reversal
- G.
Bullish Engulfing
Correct Answer(s)
A. Morning star
C. Inverse hammer
E. Three white soldiers
G. Bullish EngulfingExplanation
The correct answer identifies four types of bullish candlestick patterns: Morning Star, Inverse Hammer, Three White Soldiers, and Bullish Engulfing. Each of these patterns suggests potential buying opportunities and signals a reversal from a downward trend to an upward trend. The Morning Star pattern indicates a shift in momentum with its sequence of a bearish candle, followed by a small-bodied candle, and ending with a strong bullish candle. The Inverse Hammer, characterized by a small body with a long upper wick, signals a potential upside reversal. Three White Soldiers consist of three consecutive long-bodied bullish candles, each closing higher than the last, reinforcing a strong upward trend. The Bullish Engulfing pattern occurs when a large bullish candle completely engulfs the body of a preceding bearish candle, indicating a powerful shift in buying pressure. While these patterns are valuable tools for traders, it’s crucial to combine them with other technical indicators and market analysis to make informed trading decisions. The other options listed are not recognized as bullish candlestick patterns.Rate this question:
-
Quiz Review Timeline +
Our quizzes are rigorously reviewed, monitored and continuously updated by our expert board to maintain accuracy, relevance, and timeliness.
-
Current Version
-
Apr 25, 2024Quiz Edited by
ProProfs Editorial Team -
Sep 22, 2011Quiz Created by
Admin.ytr
- Algebra Quizzes
- Arithmetic Quizzes
- Calculus Quizzes
- Data Handling Quizzes
- Discrete Mathematics Quizzes
- Function Quizzes
- Measurement Quizzes
- Multiplication Quizzes
- Number Quizzes
- Percentage Quizzes
- Place Value Quizzes
- Probability Quizzes
- Problem Solving Quizzes
- Ratio Quizzes
- Shape Quizzes
- Statistics Quizzes
- Trigonometry Quizzes
 Back to top


