Which graph shows the effect of temperature on the rate of - ProProfs Discuss
Advertisement

Which graph shows the effect of temperature on the rate of photosynthesis?


Asked by Aj., Last updated: Apr 13, 2024

+ Answer
Request
Question menu
Vote up Vote down

4 Answers

J.Spencer

J.Spencer

Knowledge Enthusiast, Knows A Lot of Stuff.

J.Spencer
J.Spencer, Knowledge enthusiast, Tokyo

Answered Jan 21, 2019

The answer is D.

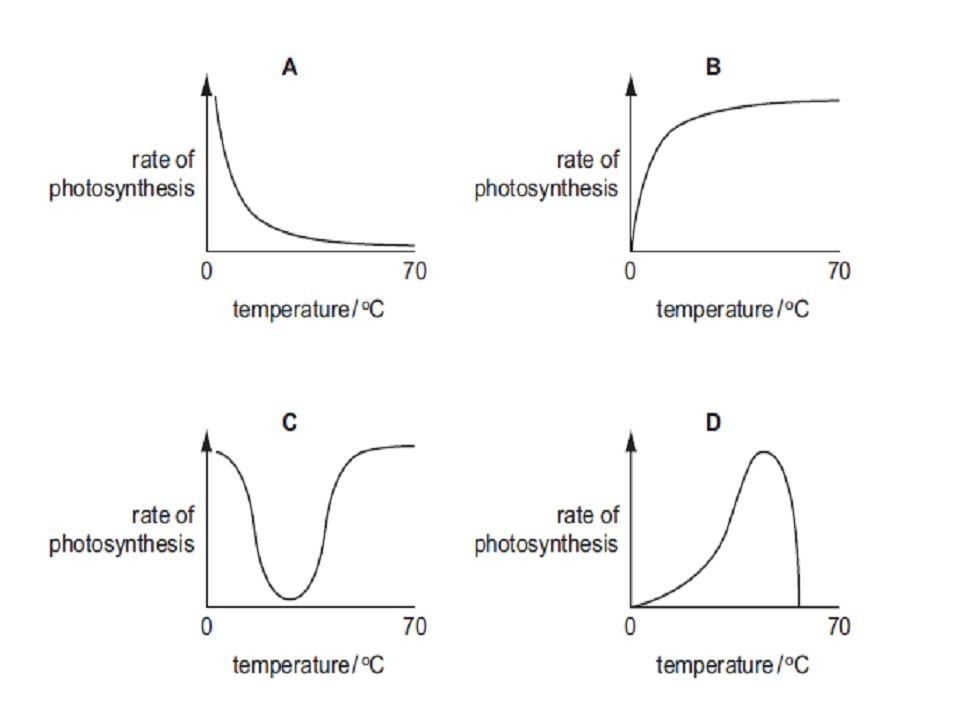
The rate of photosynthesis keeps rising until 40 degrees Celsius. Above the temperature of 40 degrees, the enzymes responsible for photosynthesis lose their shape and cannot synthesize glucose anymore. Hence photosynthesis experiences a steep drop and around 50-60 degrees, the enzymes get completely destroyed hence photosynthesis stops completely.

upvote downvote
Reply 

grinberg139

grinberg

grinberg139
Grinberg

Answered Feb 26, 2018

The answer to this is B

upvote downvote
Reply 

John Adney

John Adney

John Adney
John Adney

Answered Oct 15, 2017

B

Because the temperature acts as limiting agent as per the graphs shown

upvote downvote
Reply 

moetest9

moetest

moetest9
Moetest

Answered Oct 15, 2017

D

Photosynthesis is controlled by enzymes. High temperature will denature the enzymes. So the graph is the same as that of the enzyme.
upvote downvote
Reply 

Advertisement
Advertisement
Search for Google images Google Image Icon
Select a recommended image
Upload from your computer Loader
Image Preview
Search for Google images Google Image Icon
Select a recommended image
Upload from your computer Loader
Image Preview
Search for Google images Google Image Icon
Select a recommended image
Upload from your computer Loader

Email Sent
We have sent an email to your address "" with instructions to reset your password.