
Customer service has become a major differentiator to gain an edge over the competition. Customer expectations of service quality are also on the rise, with more and more clients becoming intolerant with brands that fail to meet their expectations.
In fact, 91% of dissatisfied customers leave brands without complaining, which means companies lose the opportunity to mend the situation.
But all is not lost. For businesses that choose to give their customers positive experiences every time they reach out, the results are rewarding. Research by Accenture shows that a significant number of customers – 45%– are ready to pay more for companies that guarantee positive customer experience.
On the importance of customer service, Tony Hsieh has said, “Customer service should not be a department. It should be the entire company.”
With the changing customer behavior and expectations, companies are becoming more customer-centric and are now focusing on improving the quality of support services by:
- Training the support staff to provide customers with delightful experiences
- Investing in tools such as help desk ticketing system that enhances customer service efficiency
- Setting up self-service portals such as knowledge base and FAQs to provide reps with a go-to information source, that they can use to find answers to customer questions, instantly.
- Acquiring customer feedback to bring improvements in the products, services, and processes.
With companies making significant investments towards customer service, which indicators can they use to measure customer service performance? In this article, we look at different customer service metrics that can help you measure the performance of your customer service division.
But What Is the Customer Service Metric?
Simply said, customer service metrics are key performance parameters that tell you exactly how the customer service function is contributing to the overall growth of your business.
Here are 30 customer service KPIs that you can use to track customer service performance in your business:
1. First Response Time
Speedy response to queries is an essential driver of customer satisfaction because when customers contact a company, they expect a fast response. 85% of customers who contact businesses through Facebook and 77% of those who use email expect a response within 6 hours. Talking specifically about social media, 48% of customers expect answers to their questions within 24 hours. However, only a few firms are able to meet this expectation.
This metric helps you measure the speed at which customer requests are addressed.
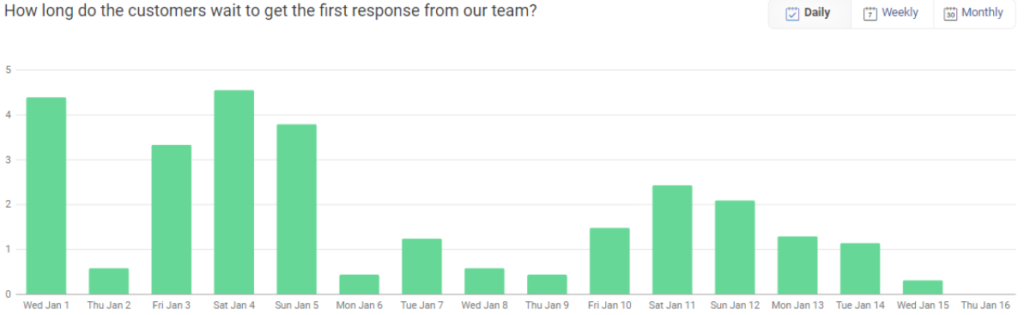
To calculate First Response Time, you need to get the total time taken to respond to customers over a selected period of time and divide it with the total number of responses sent to customers over the same period. This gives a single numeric, which represents hours that pass before a response is sent to customers, which is basically your average First Response Time.
2. Customer Request Volume
This customer service performance metric gives businesses an idea of how many requests are sent to the service team through different communication channels over a specific period. When measuring customer request volumes, it is crucial to consider periods when there is a higher number of requests because, during this time, the load on your support staff will also increase.
Tracking customer request metrics helps you in various ways:
- Understand the workload in the customer service department
- Determine the volume of customer requests handled over a given period of time
- Determine whether there are sufficient service agents to sustain the current level of customer satisfaction.
This information influences certain decisions, such as:
- Whether to hire additional service agents or not
- If customer request volumes are high, you can decide to put in place strategies like developing a customer service knowledge base and implementing live chat to reduce request tickets
- The number of resources to allocate towards the customer service functions
3. Resolution Rate
This metric shows how effective you are when it comes to resolving customer issues. The resolution, in this case, is determined by the customer – not the service team. An issue should only be considered as resolved once the customer has confirmed it. Businesses that compute resolution rates often look at the total number of customer requests received over a specified period and determine how many of those issues were addressed.
Often expressed as a percentage, the resolution rate is calculated by dividing the number of customer requests that have been resolved with the total number of customer requests received. A high percentage means that the company is effective in resolving customer issues, while a low percentage is a reflection of ineffectiveness in addressing customer requests.
4. First Contact Resolution Rate
Customers want instant gratification these days, and this is one reason why customers are slowly becoming impatient.
Being able to resolve customer issues in a single contact can help businesses achieve this. However, this does not always happen. In reality, customers will have to follow up queries, and service agents will seek clarifications from customers to better understand their issues. Using the First Contact Resolution Rate metric, you can track the number of customer issues that get resolved with a single contact.
| First contact resolution rate = Total number of customer requests resolved with a single response during a particular time period/Total number of customer requests received during the same period.
Multiply the figure by 100 to get the percentage. |
A high first contact resolution rate means customers don’t have to put too much effort into getting their issues resolved. On the other hand, a low rate means customers contact the support staff of a company multiple times to get answers to their questions. This means more effort on the part of customers.
When calculating the first contact resolution rate, you can check the number of responses service team sends customers on an average before issues are resolved.
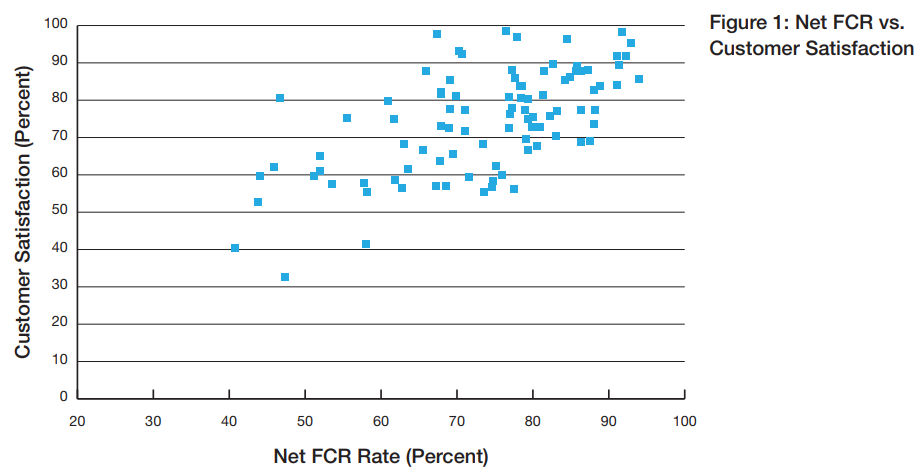
Source: Thinkhdi
To improve your first contact resolution rate, you can:
- Share links to relevant knowledge base articles with customers to enable them to resolve their issues by themselves
- Send automatic responses to customers informing them that their requests have been received and that they will be contacted within a short while
- Use a help desk software to route customer tickets, automate tasks and give service agents access to customer profiles and history for quick ticket resolution
- Analyze the contact behavior of your customers to predict their needs in advance
5. Average Handle Time
This is a call center metric that measures the efficiency of the customer service team. The more you are able to reduce your average handle time, the more resources you can save. The average handle time metric enables you to determine the time service agents spend handling a customer issue.
For instance, you could measure how long a service rep spends on a customer call – from the moment the agent picks up the call, to the time they hang up. If customers send their issues via email, you can track how long it takes a service agent to respond to the customer – from the time the email is opened, till a response is sent.
Monitoring the average handle time enables customer service managers to:
- Spot gaps that need fixing for better performance of the service process
- Identify follow up tasks that can be automated so that service agents are available to focus on incoming calls or emails.
- Find ways to improve efficiency so that agents don’t have to keep customers on call for long or spend too much time writing an email. Some ideas for doing this include:
- Setting up a customer knowledge base with articles that service teams can recommend to customers.
- Using an internal knowledge base to provide service teams with the information they need to respond to customers faster.
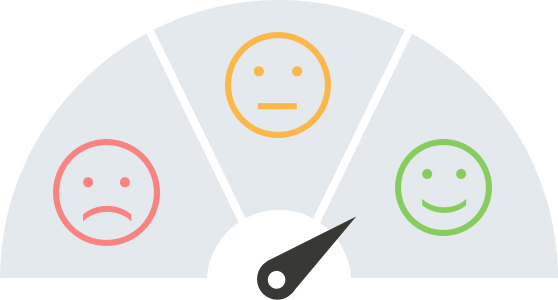
6. Customer Satisfaction Score
This score determines how satisfied your customers are with your products and services. To get this score, the ideal way is to roll out a customer satisfaction survey that gives you an indication of how satisfied and loyal customers are towards your brand.
Most businesses request customers to complete satisfaction surveys after their tickets are resolved. Since this metric relies on the feedback received from individual customers, you may experience challenges getting customers to complete the survey, especially if they are unhappy or frustrated. This means the score you get may not be accurate.
In case you experience this challenge, here are some tips to help you get more customers to complete the customer satisfaction survey:
- Have your service agents personally request individual customers to give feedback
- Send the customer satisfaction survey to customers immediately after they agree to take the survey
- Set time expectations in advance by letting customers know how long it will take them to complete the survey so that they are well prepared
- Show customers the value of completing the survey. Ensure that their feedback will be incorporated, and it will also your company improve its offerings.
- Provide proof of how the company has acted on customer feedback by highlighting one or two real cases
7. Customer Churn Rate
This is an important customer service performance metric for any company because it provides information on the percentage of customers who have quit buying from the business. Customer churn rate is expressed either as a percentage or by the actual number of customers who have stopped buying from a company.
It is calculated by taking the number of customers who leave your business over a given period of time and dividing it by the total number of customers you had over that particular time.
Customer churn rate is essential as it:
- Helps in measuring how healthy your business is and its ability to achieve the long-term vision
- It allows you to determine which of your customers are most loyal to your brand.
- Plays a critical role in projecting the performance of your company in the future
- Enables you to identify changes that could affect customer retention adversely
- Helps you track your customer retention performance on a month-on-month basis
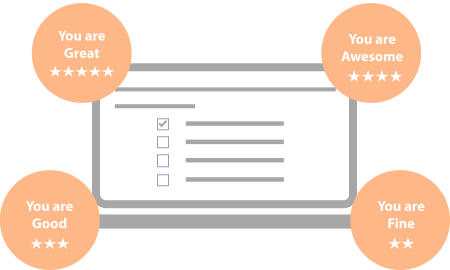
8. Customer Effort Score
The customer effort score reflects the level of ease for customers to interact with your support staff. Essentially, this metric gives you an idea of how hard customers have to work to get their issues addressed.
 This score is determined after analyzing the feedback provided by customers in your customer effort survey. The best way to get customers to respond to your customer effort survey questions is by sending the survey immediately after they buy a product or subscribe for a service from your business or right after they have interacted with a customer service agent.
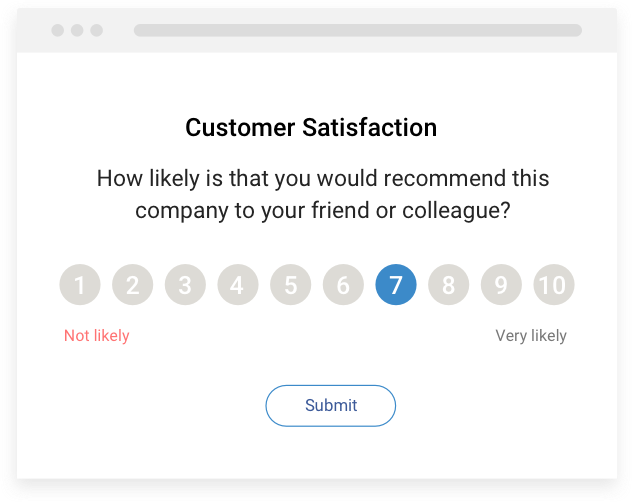
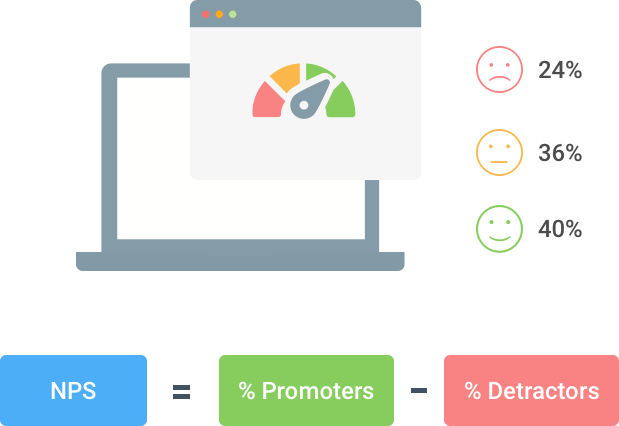
9. Net Promoter Score
This metric is often expressed in percentage format and is useful for measuring how loyal customers are to a brand or product. NPS helps you determine the likelihood that customers will recommend your products or services to others. With this metric, you can tell which customers will most likely stop buying from you and which ones might promote your brand.
To get the net promoter score, you have to conduct a survey where customers give a rating of their likelihood to suggest your products or services to others.
The outcome of the survey is used to calculate the net promoter score by subtracting the number of detractors from the promoters. Detractors are basically customers who give a score of between 0 and 6, while promoters are those who give the highest ratings of 9 or 10.
10. Average Response Time
When customers contact you, they expect to receive a response at lightning speed. In fact, for 12% of Americans, lack of speed is one of the major causes of their frustration with customer service.
Using tools such as knowledge base, live chat, and help desk, companies are now able to provide customers with instant gratification in the form of quick and accurate answers.
The average response time metric helps you determine the average time your service agents take to provide feedback to customers after a ticket is acknowledged. This gives you an idea of how fast your support staff is while resolving customer issues and giving feedback. A fast response time demonstrates to customers that their issues are kept on priority.
There are several ways you can reduce customer response time such as:
- Decreasing issue escalation by equipping your support staff with a self-service knowledge base that they can access immediately while responding to customer queries. Enable your team to work independently by making them self-sufficient.
- Ensuring that each service agent has a manageable workload. If they are handling too many issue tickets, there will be response delays.
11. Rate of Ticket Resolution
The ticket resolution rate helps you keep track of the number of issue tickets that get addressed over a specified period compared to those that remain unresolved. The ticket resolution rate shows you how efficiently the service team is able to answer customer questions.
This means the higher the ticket resolution rate, the higher the efficiency of your support staff. Expressed as a percentage, it enables you to determine the number of tickets that are left unresolved over the same period.
By and large, the rate of ticket resolution depends on factors such as average reply time and ticket backlog volume. It can be calculated by dividing the number of tickets that have been fully resolved by the total number of tickets received.
Wondering how to improve your ticket resolution rate?
Here’s how you can do so easily:
- Provide your support staff with the information they need to resolve customer queries fast. For instance, a knowledge base is a great way to empower reps with information regarding your products, services, policies, etc. and help them answer questions instantly.
- Use help desk software to fast track ticket resolution. A robust help desk tool facilitates ticket routing, multichannel communication, and tracking of issue tickets – all these improve ticket resolution speed.
- Add more agents to your customer support squad to handle the growing number of issue tickets.
12. Average Ticket Count
Average ticket count is a great way to determine the volume of customer tickets that your service team receives over a specific period of time. A high number of issue tickets could mean the customer service staff is working well and can be easily approached by customers. But, on the other hand, it may also mean that the products or services offered are of low quality, with customers facing persistent problems.
So, the lower the number of tickets, the better it is for your business. A lower rate indicates that customers are facing fewer challenges with the products or services offered by you.
To maintain a low average ticket count, ensure that feedback about products or services is communicated to the product development and marketing teams so that gaps identified by customers are addressed at the earliest.
13. Ticket Backlog
Customers give paramount importance to the speed at which their queries are solved. Having a ticket backlog means that your business is not meeting this expectation.
If you want to determine the volume of unresolved customer tickets in your company, ticket backlog is the metric to use. With this metric, you can determine the number of tickets that remain unresolved in a specific period of time – could be per day, week, or month.
Ticket backlog refers to tickets that remain after you have determined the issue resolution time and average reply time. It gives you a clear picture of how fast your service team is receiving, responding, and addressing customer issues.
In tracking ticket backlog, a low level of unresolved tickets is considered ideal. Often, it points to a team that is efficient in responding to customers and is good at resolving their issues instantly.
14. Interactions per Issue Ticket
This customer service metric helps you know the number of interactions customers have with your support staff before their issue tickets get resolved. It measures the number of times the service team communicates with customers in the course of resolving an issue. With the interactions per issue ticket metric, you can tell how competent your support staff is at communicating with customers.
Businesses that have few interactions with customers during the issue resolution process tend to have service teams that:
- Ask customers thoughtful questions to understand their issues
- Communicate to customers in an easy to understand the manner
- Go out of their way to resolve customer issues fast
To reduce the number of interactions between reps and customers, consider training your staff on how to ask them the right questions that clarify their issues.
15. Time to Resolution
Issues vary from one customer to another. In the same way, some customer support tickets take longer to close than others. If you want to know what issues your support staff spends most of their time on, the time to resolution is your go-to metric.
With this customer service performance metric, you can evaluate the average time taken by your support staff to resolve a customer issue. It is an essential metric in terms of helping businesses understand which products have problems that take the most time to address. This information enables managers to identify the type of tickets that reps spend a lot of time on, and also the time spent in every stage of the resolution process.
With this information, you will be able to:
- Categorize customer issues and devise strategies for reducing the amount of time support staff spends on resolving complex issues
- Find ways to help the customer service team address serious concerns by providing them the right training.
- Share customer feedback with the marketing and product development teams to improve the quality of your offerings and create customer-centric products.
16. Customer Reviews
Keeping an eye on customer reviews can go a long way in helping you improve and enhance your offerings. In business, some customers will be happy, while some will be frustrated thanks to their not-so-good experience with your brand.
However, customers who have negative experiences with a brand are more likely to write reviews than those who have positive experiences. In most instances, to get positive reviews from satisfied or happy customers, you need to push and make extra efforts to convince customers.
While you can run different campaigns to gather reviews, customer service reps are often better placed to get such reviews because they interact with customers frequently.
To increase the number of positive customer reviews for your firm, service teams should be able to:
- Request customers for quick reviews
- Share links to website pages where customers can leave reviews
- Incentivize customers to leave reviews by offering small upgrades or discounts that the company has approved
17. Answered Calls Rate
This customer service metric enables you to determine how many calls made by customers are actually answered. One of the challenges customers experience with service teams is difficulty in getting a real service agent to talk to.
In phone support, this means a high number of missed calls, leading to increased frustration in customers. This is not good for any business, particularly in an environment where 32% of buyers are willing to walk away from a business after experiencing just one negative customer service experience.
To calculate the answered calls rate, all you need to do is divide the number of answered service calls by the total number of requests received. Once you have your answered calls rate, you will get clarity on the total number of answered calls.
18. Preferred Communication Channel
You also need to be aware of the communication channels that customers prefer using when interacting with your reps. When you know the channels used by customers, you will be able to evaluate the number of customer issues and queries that are submitted through different channels, including live chat, social media, email, phone, etc.
Understanding the communication channels that customers prefer to use helps you allocate sufficient resources to the customer service department. At the same time, your customer support staff is able to engage customers via those channels – which helps in boosting customer experiences.
19. Active Customer Issues
With this customer service metric, you can keep track of issues that have been received but not yet resolved completely. This metric is closely linked to the first contact resolution rate in the sense that when customer issues get addressed with a single contact, active issues are significantly low.
On the other hand, a high number of active customer issues could be an indication of several things that require further investigation:
- The customer service team is receiving too many customer issues – which could mean that there are problems with the products or services offered by you
- Service agents are taking too long to resolve a single customer issue
- There is too much back and forth communication between customers and service agents
20. Customer Repurchase Rate
Loyal customers are those who buy a product from a company and keep coming back for more. It is loyal customers that fuel growth in any business because they keep sales revenue flowing. Customer service plays a significant role in boosting customer loyalty. Statistics show that 93% of buyers will make repeat purchases in businesses that provide them with excellent service.
The customer repurchase rate enables you to measure customer loyalty by keeping track of customers who buy your products over and over again. To calculate it, you should take the number of repeat customers, divide it by total customers received during that particular time period, and then multiply by 100 to get the right percentage.
A high customer repurchase rate means that your customer service team is effective in addressing customer concerns. On the contrary, a low rate points to a service team that may not be too efficient.
Some tips for increasing customer repurchase rate through service teams include:
- Seeking customer feedback on products or services offered by you and sharing that with the product development team for improvements
- Listening to unhappy customers and working towards addressing their issues to rebuild their trust in your brand
- Focusing on delighting customers by going the extra mile to resolve their issues
21. Self-Service Usage Rate
Self-service is the first preference of 66% of customers to find answers to their questions, as per a report by Microsoft. To ensure customers have a great experience, most companies are now providing self-service customer support options so customers can resolve issues by themselves.
Whether it’s a knowledge base or FAQs, if your company has created a self-service portal, this metric enables you to track how your customers make use of that facility. The self-service usage rate is calculated by comparing the number of hits on self-service portals to the number of issue tickets sent by customers in a specific timeframe. A high self-service usage rate means that many customers find the content useful and helpful.
22. Ticket Submission by Time and Channel
This customer service metric enables you to keep track of new customer issues submitted to the service team, clearly showing when those issues were submitted and which communication channel was used to submit them.
This information is crucial for service managers because it helps them determine the time when they can expect an influx of customer issues. With these details, you can make informed decisions that ensure that support agents are deployed in such a manner that they can use their time judiciously, with no customer issues going unattended.
23. Backlog Outflow and Inflow
Backlog outflow and inflow help you monitor customer issue backlog by comparing the number of issue tickets received with the number of issues resolved and successfully closed. This metric enables customer service managers to determine whether the backlog is shrinking or increasing over time.
A shrinking backlog reflects efficiency on the part of service teams. However, if the ticket backlog is increasing, it could mean that your current service team is overburdened, and there is a need to hire additional reps.
24. Service Activities
Customer service is about working as a team to resolve issues as fast as possible with the aim of attaining higher retention. To do this, you should understand which activities your support staff spends time on.
With this metric, you can:
- Determine the amount of work that customer service desk has
- Identify tasks that can be automated and the ones that need to be handled by people
- Find out whether the customer service function has sufficient staff to handle the workload
- Determine whether the work that service teams are involved in aligns with the number of closed tickets
25. Top Service Agents
This customer service metric focuses on helping your service managers to identify and motivate service agents who perform exceptionally well. To determine which reps are worth recognizing, you may review their productivity using other service metrics such as the number of calls handled over a specified period, their first call resolution rate, and customer feedback on the quality of support services provided.
Some tips for motivating top-performing service agents are:
- Recognizing them publicly e.g., through showcasing service rep of the month or year
- Giving them promotions
- Providing them with opportunities to get showcased on your website by writing blogs or knowledge base articles.
26. Adherence to Service Level Agreements
Unlike other indicators that are primarily focused on customers and service team members, this metric allows you to review your overall performance in meeting your commitment as laid out in the Service Level Agreement entered with your customers.
For example, if a company has stated that email requests will be replied to within an hour, the service level metric will make it possible for the company to measure progress towards achieving this goal. Where progress results are positive, it means the company respects the commitments it makes to customers.
Failing to track service level agreement adherence can cause you to stay away from what matters to customers and overlook customer service gaps.
27. Cost of Customer Service vs. Revenue
Every company seeks to reduce operational costs while maximizing profits. For this reason, you should track expenses associated with customer support. This service metric looks at the cost of customer support in relation to the total revenue generated.
Generally, the metric paints a clear picture of what the customer service function represents in light of your company’s total revenue. One way of doing this is by knowing how much it costs you to resolve customer support tickets. To determine the cost of each ticket resolved, you can take the total cost of support and divide it by the number of customer issues.
28. Ticket Escalation Rate
This is an important customer service metric that is closely related to the first contact resolution rate. With the issue escalation rate, you are able to track the percentage of customer issues that are escalated to other staff by the customer service team.
Calculation of escalation rate is done by taking the number of escalated issues and dividing it by the total number of issues received from customers over a specific period.
Where the escalation rate is high, it could mean that:
- The products or services the company is offering have faults that need to be looked into
- The support staff is not empowered to handle some customer issues
29. Articles Published on the Knowledge Base
This metric is often ignored by the customer service team, as its impact is still not clear to many. As more customers turn to self-service portals, maintaining an updated knowledge base is not just an option, but a prerequisite. By setting up a knowledge base, reps can respond to customer queries even before they are raised.
As people who interact with customers on a day to day basis, customer service agents play a key role in creating relevant knowledge base content. Tracking the number of knowledge base articles that get published over a specific period gives you an idea of how active support staff is in creating content that is demanded by customers.
30. Customer Lifetime Value
This customer service metric enables you to measure how the value your business and customer support staff provides to customers during their association with your firm. When the positive experiences you provide to your customers start bringing you more revenue, consider that your customers’ lifetime value is good and impressive.
Customer lifetime value is all about the experiences you offer. The better your experiences, the higher will be the probability of more customers coming back to your brand. Also, when your customer lifetime value is high, it is a strong indication that your support staff is doing its job effectively.
Wrap Up
Customer service metrics serve the important purpose of pointing companies in the right direction. They have the power to show you what is working, what is not, and what needs to be improved. While the information they provide is valuable, it is the action that your business takes that will ultimately bring a difference.
To start improving your customer service, find the metrics that are most suitable for your business. If you are just beginning to use them, you may want to start with the most basic ones like average call handling, ticket count, and backlog to monitor your customer service performance.
As you get more comfortable, keep expanding your list until you are able to take on more complex metrics.
Do you want a free Knowledge Base?
We have the #1 Online Knowledge Base Software for instant self-help